
Figures & data
Table 1 Demographic characteristics of subjects with negative (n=114) and positive (n=245) cultures from 2010 to 2012
Figure 1 Smoking and the success rate of treating tuberculosis and CXR grading.
Notes: (A) Proportion of success rate of treating tuberculosis (TB) in patients with positive cultures who were nonsmokers, former smokers, and current smokers (No, treatment failure; Yes, treatment success). (B) Chest X-ray (CXR) grading of patients with TB-positive cultures who were nonsmokers, former smokers, and current smokers. *P<0.05.
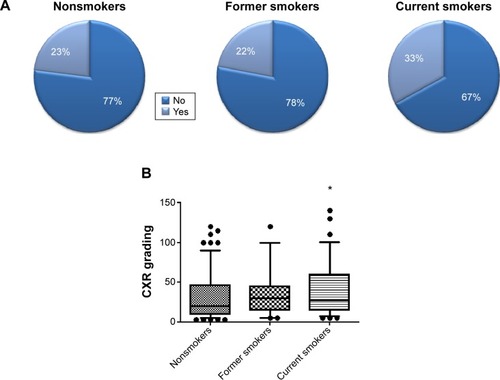
Table 2 Estimated ORs (95% CI) of the risk for tuberculosis patients with positive cultures among former smokers and current smokers
Table 3 Hazard ratios of sputum-culture conversion duration (days) in subjects with tuberculosis-positive cultures