Figures & data
Figure 1 SDF-1α and CXCR4 expression in AVM lesions.
Notes: (A) IHC staining of SDF-1α, ×200. (B) CXCR4 IHC staining image, ×200. (C) Double immunofluorescence images of CXCR4 (red) and CD45 (green). Scale bar =20 μm. The white box is magnified in the right panel. (D) Double staining of CD133 (left, green) and CD34 (middle, red). Scale bar =50 μm.
Abbreviations: IHC, immunohistochemistry; AVM, arteriovenous malformation; SDF-1, stromal cell-derived factor-1.
Abbreviations: IHC, immunohistochemistry; AVM, arteriovenous malformation; SDF-1, stromal cell-derived factor-1.
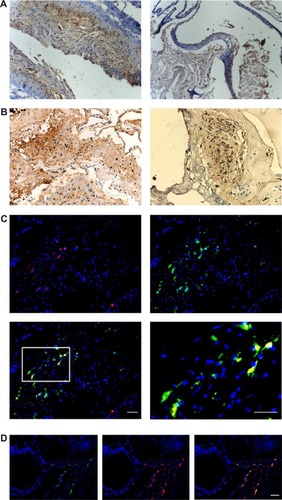
Figure 2 EPCs from peripheral blood.
Notes: This figure showed flow cytometry results of AVM patients (A); in controls (B). Left panels, raw images; middle panels, CD133+/CD34+ double-positive cells (upper right quadrant); and right panels, CD133+/CD34+/KDR+ triple-positive cells (upper right quadrant).
Abbreviations: EPCs, endothelial progenitor cells; AVM, arteriovenous malformation.
Abbreviations: EPCs, endothelial progenitor cells; AVM, arteriovenous malformation.
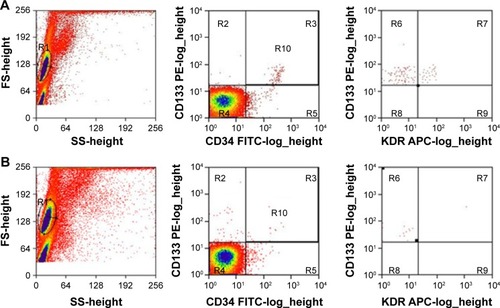
Figure 3 CD45+ expression in chronic hypoperfusion mice.
Notes: (A) Control; (B) 24 hours after surgery; (C) 7 days; (D) 42 days; and (E) 90 days after surgery. Magnification: ×400.
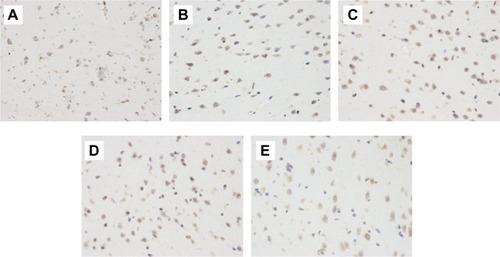
Table 1 Microvessel density (/mm2) between sham and model animals
Table 2 SUVmax value of left MCA cortex in control group and model groups
Table 3 Serum SDF-1α levels (pg/mL)
Figure 4 CD45/CXCR4 coexpression in AMD3100-treated mice.
Notes: (A) This figure shows representative double-immunofluorescence staining of CD45 (green) and CXCR4 (red) in AVM tissues. (B) This shows the quantified results of double-positive cells across control, AMD3100-, and saline-treated animals.
Abbreviation: AVM, arteriovenous malformation.
Abbreviation: AVM, arteriovenous malformation.
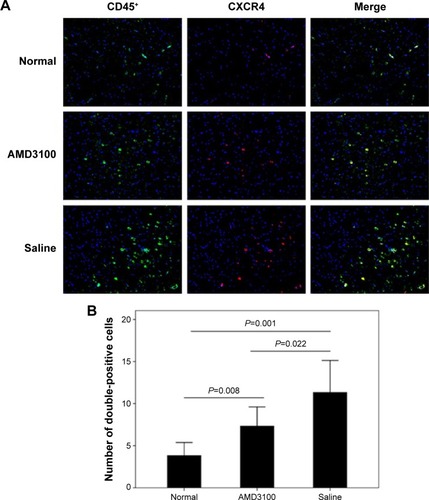
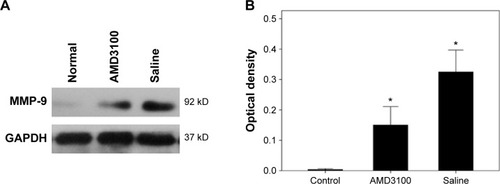
Figure 5 MMP-9 expression in AMD3100-treated mice.
Notes: (A) Western blotting bands. (B) Quantified results (in optical density) showing MMP-9 protein levels in control, AMD3100-, and saline-treated animals. *P<0.05 compared to the normal ones.