Figures & data
Table 1 Structure of prescription – general data (n=2,442)
Table 2 Structure of treated patients with antibiotics by age subgroup (n=2,442)
Figure 1 Utilization of antibacterials for systemic use – J01 (World Health Organization Anatomic Therapeutic Classification [ATC] Level 3) by ATC System with Defined Daily Doses (DDD) methodology.
![Figure 1 Utilization of antibacterials for systemic use – J01 (World Health Organization Anatomic Therapeutic Classification [ATC] Level 3) by ATC System with Defined Daily Doses (DDD) methodology.](/cms/asset/12f185ab-ea68-4096-95b3-673a88945c0f/dtcr_a_87595_f0001_c.jpg)
Figure 2 Utilization of individual antibacterials for systemic use (World Health Organization Anatomic Therapeutic Classification [ATC] Level 5) by ATC System with Defined Daily Doses (DDD) methodology.
![Figure 2 Utilization of individual antibacterials for systemic use (World Health Organization Anatomic Therapeutic Classification [ATC] Level 5) by ATC System with Defined Daily Doses (DDD) methodology.](/cms/asset/5254b761-23e6-40b0-a46b-7e767a0d1fea/dtcr_a_87595_f0002_c.jpg)
Figure 3 Utilization of individual analgesics (World Health Organization Anatomic Therapeutic Classification [ATC] Level 5) by ATC System with Defined Daily Doses (DDD) methodology.
![Figure 3 Utilization of individual analgesics (World Health Organization Anatomic Therapeutic Classification [ATC] Level 5) by ATC System with Defined Daily Doses (DDD) methodology.](/cms/asset/c8a8b860-7cb3-48ea-a9b7-e1d5fd83582f/dtcr_a_87595_f0003_c.jpg)
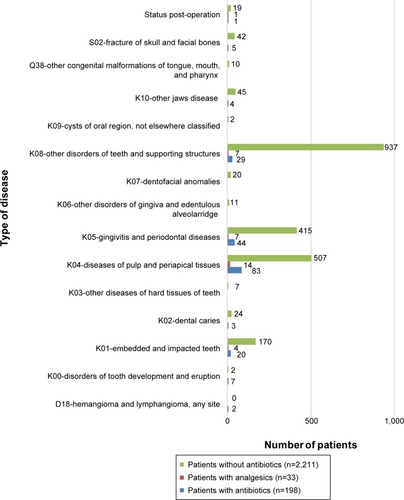
Figure 4 International Statistical Classification of Diseases and Related Health Problems: 10th Revision classification of disease by number of patients and modality of prescription of antibiotics and analgesics (n=2,442).