
Figures & data
Table 1 Baseline characteristics of the patients
Figure 1 The mean measurements of intracranial pressure (ICP) in the two study groups 1 hour before and 7 days after treatment.
Note: The error bars indicate standard deviation.
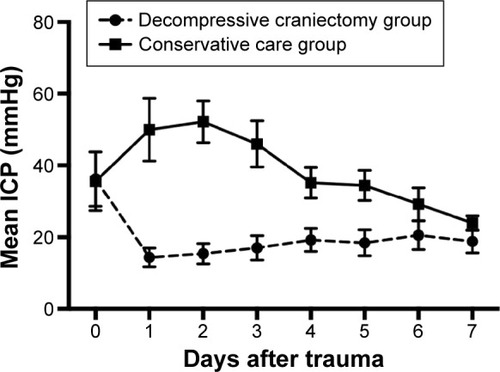
Figure 2 The survival of patients in different groups over time.
Notes: (A) The survival of patients in different groups in one week. (B) The survival of patients in different groups in two weeks. (C) The survival of patients in different groups in six months. The deceased cases occurred within 3 days after trauma in conservative care group, among which 72.22% occurred within 24 hours; while 81.82% of the cases occurred within 1 week in the decompressive craniectomy group, in which the highest mortality (approximately 45%) was observed between 3 days and 1 week and the mortality decreased gradually after that (P<0.001).
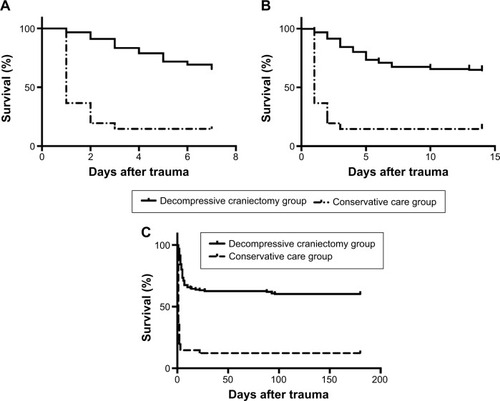
Table 2 Mortality and survival in different treatments
Table 3 Glasgow Outcome Scale (GOS)