Figures & data
Table 1 Characteristics of the PD patients
Table 2 Comparison of patients with iPTH ≥180 pg/dL and without iPTH <180 pg/dL hyperparathyroidism
Table 3 Logistic regression analysis between hyperparathyroidism (iPTH $180 pg/dL) and clinical variables (n=141)
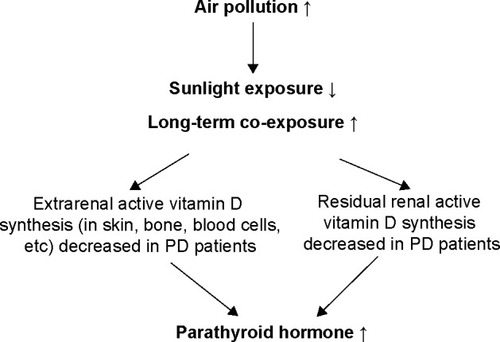
Figure 1 Comparison of patients living in high and low CO-exposure areas.
Notes: Patients living in high CO-exposure areas had higher iPTH levels than patients living in low CO-exposure areas. High and low CO exposures were separated by a mean value of 0.53 ppm. iPTH, nPNA and hs-CRP are represented as median values, and the others are represented as mean values. *P<0.05.
Abbreviations: iPTH, intact parathyroid hormone; nPNA, normalized protein nitrogen appearance; P, phosphate; hs-CRP, high-sensitivity C-reactive protein; CCrn T, total creatinine clearance; KT/Vurea T, peritoneal KT/Vurea + renal KT/Vurea; WBC, white blood cell; Hb, hemoglobin.
Abbreviations: iPTH, intact parathyroid hormone; nPNA, normalized protein nitrogen appearance; P, phosphate; hs-CRP, high-sensitivity C-reactive protein; CCrn T, total creatinine clearance; KT/Vurea T, peritoneal KT/Vurea + renal KT/Vurea; WBC, white blood cell; Hb, hemoglobin.
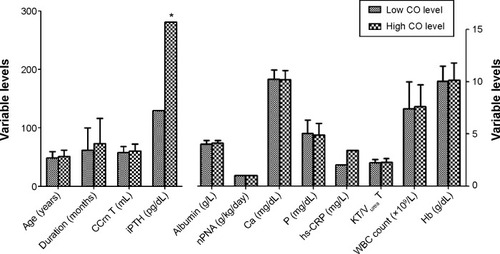
Figure 2 Inference of the correlation between air pollution, CO, and parathyroid hormone.
Abbreviations: ↓, decrease; ↑, increase; PD, peritoneal dialysis.