
Figures & data
Figure 1 Characteristic changes (infiltration of lymph) within the second toe – a massive Stemmer’s sign.
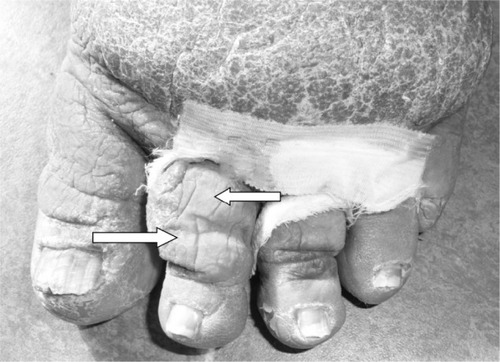
Figure 2 Positive compression test – a specific indentation characteristic for protein-rich fluid under the skin.
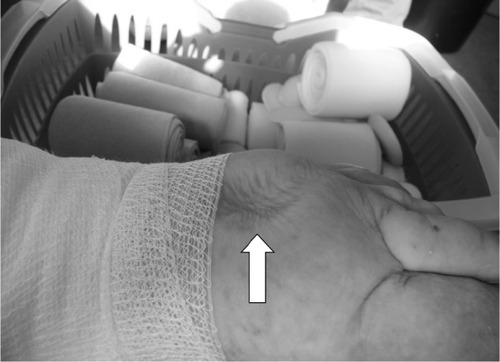
Figure 3 Study flowchart and CONSORT diagram.
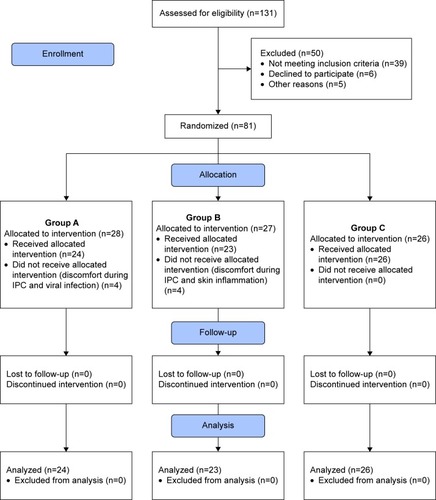
Table 1 General characteristics of the study population in groups A, B, and C
Table 2 Characteristics of chronic venous insufficiency in given groups
Table 3 Patients’ characteristics in terms of edema according to categories by Olszewski
Table 4 Patients’ characteristics in terms of edema according to categories by Brunner
Figure 4 The IPC device.
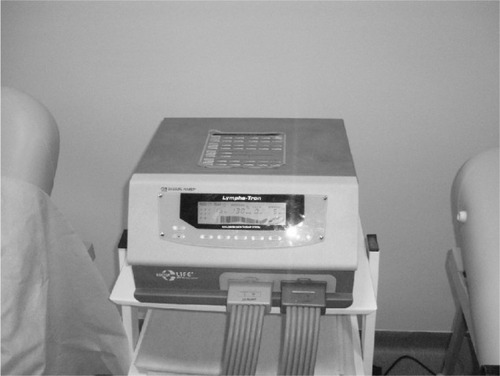
Figure 5 The 12-chamber IPC application.
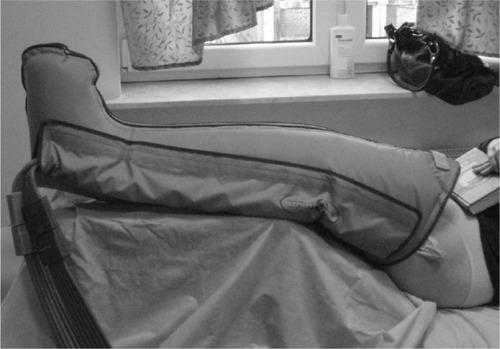
Figure 6 The Perometer 400T measurement.
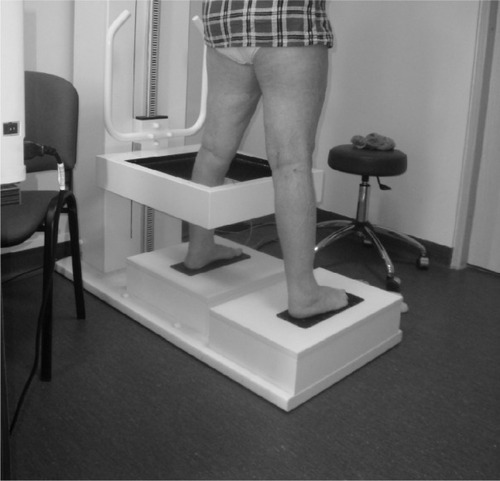
Table 5 Between-group comparisons of changes in right limb volume (cm3)
Figure 7 Comparison of percentage edema reduction in the right lower limb between groups A, B, and C.
Abbreviation: IPC, intermittent pneumatic compression.
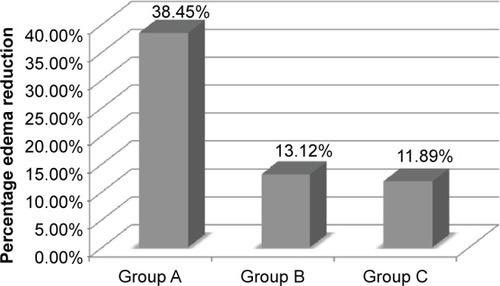
Figure 8 Comparison of percentage edema reduction in the left lower limb between groups A, B, and C.
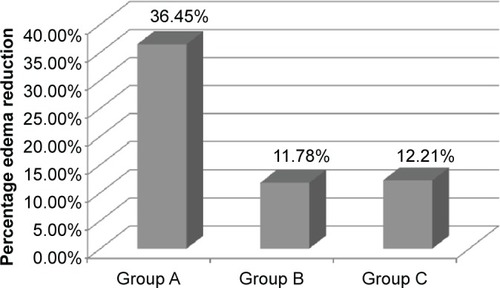
Table 6 Between-group comparisons of changes in left lower limb volume (cm3)