
Figures & data
Table 1 Patient characteristics enrolled in this study (n=106)
Table 2 Patient characteristics according to chemotherapy regimen
Table 3 Treatment compliance according to PNI
Figure 1 Kaplan–Meier recurrence-free survival curve according to the prognostic nutritional index before adjuvant chemotherapy: log-rank P=0.001 (number of patients; PNI <50=54, PNI ≥50=52).
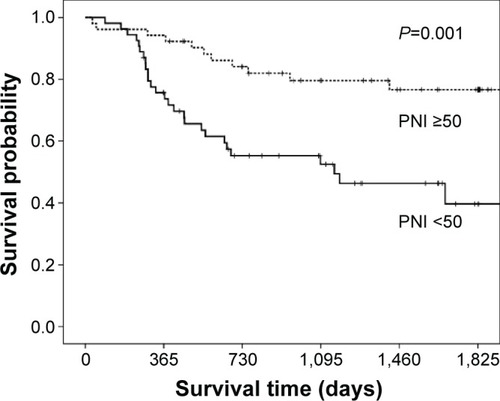
Table 4 Prognostic analysis of factors predicting recurrence-free survival in adjuvant chemotherapy: univariate and multivariate analysis in all cases
Figure 2 Kaplan–Meier recurrence-free survival curve according to the prognostic nutritional index before adjuvant chemotherapy.
Abbreviations: PNI, prognostic nutritional index; PB, platinum-based; FT, tegafur.
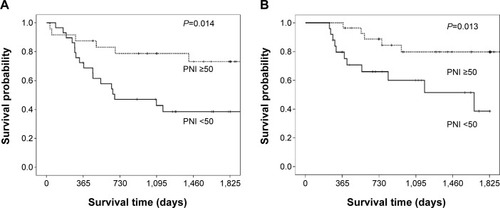
Table 5 Prognostic analysis of factors predicting recurrence-free survival in adjuvant chemotherapy: multivariate analysis according to chemotherapy regimens