
Figures & data
Figure 1 Geographical locations of up to date reported Hendra virus (blue) and Nipah virus (pink) outbreaks.
Note: The black line running across the image approximates the Wallace line where the ecozone of Asia starts to transition into the ecozone of Australia.
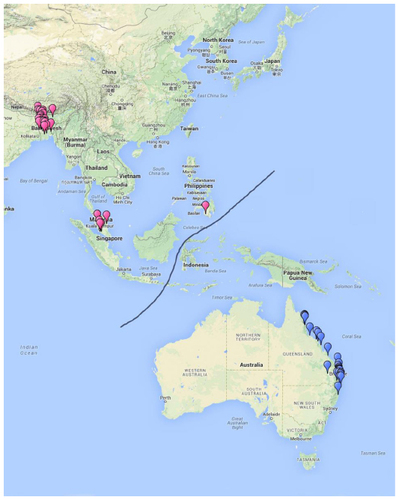
Figure 2 Structure of the Nipah virus virion core.
Notes: (A) Nucleocapsid core with residual envelope; (B) herringbone-shaped fragment of the nucleocapsid with immunogold labeling of P proteins. Images are courtesy of L Burton and Dr Y Berhane.
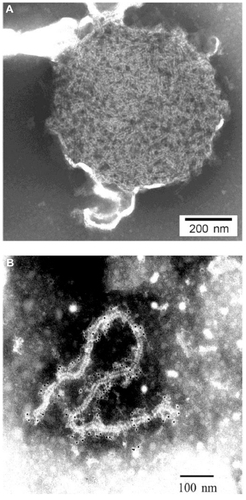
Figure 3 Generalized summary of the current understanding of pathogenesis. The figure represents an overall picture covering a number of susceptible species.
Notes: There are some virus and host species differences in pathogenesis, eg, in terms of invasion of the central nervous system, or in immune cell targets. For example, NiV in hamsters and swine can cross the blood–brain barrier, and also reach the brain via cranial nerves. Initiation of infection by inhalation of small (aerosol) droplets is still not fully confirmed.
Table 1 Summary of vaccine efficacy reports