
Figures & data
Figure 1 Graphical representation of (A) perceived stress, (B) perceived health status, and (C) perceived heart attack risk in the study population.
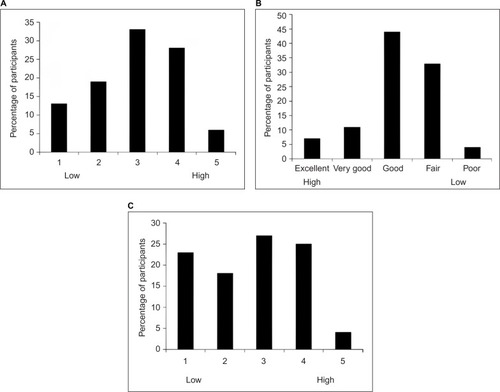
Table 1 Physical characteristics of study population
Table 2 Summary of survey data for all participants
Table 3 Biological characteristics of study population
Table 4 Association of risk factors with Framingham score
Table 5 Association of risk factors with perception of overall health
Table 6 Association of risk factors with perception of heart attack risk