
Figures & data
Figure 1 Course of systolic BP and diastolic BP in patients admitted within 6 h or after 6 h of symptom onset.
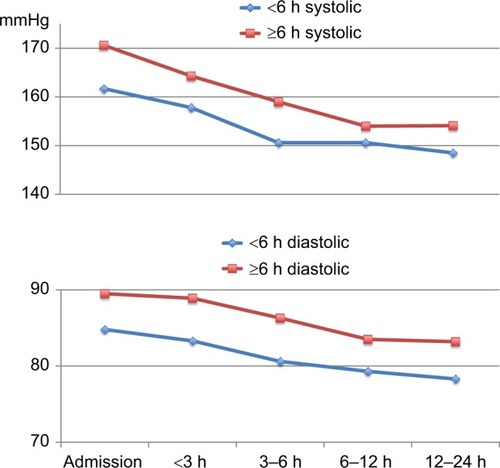
Figure 2 Course of systolic BP and diastolic BP in patients with proximal MCA occlusion on MRA at 24 h (occlusion) and in patients with normal findings on MRA at 24 h and admission NIHSS score >10 (no occlusion).
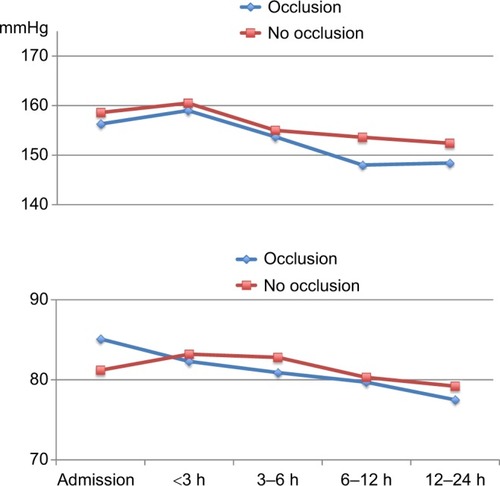
Figure 3 Course of systolic BP in patients with different DWI lesion locations.
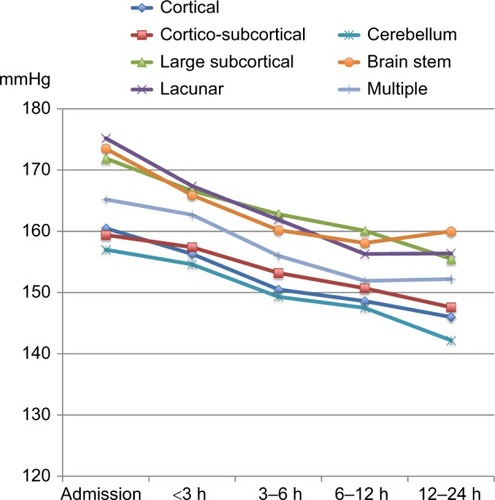
Figure 4 Course of diastolic BP in patients with different DWI lesion locations.
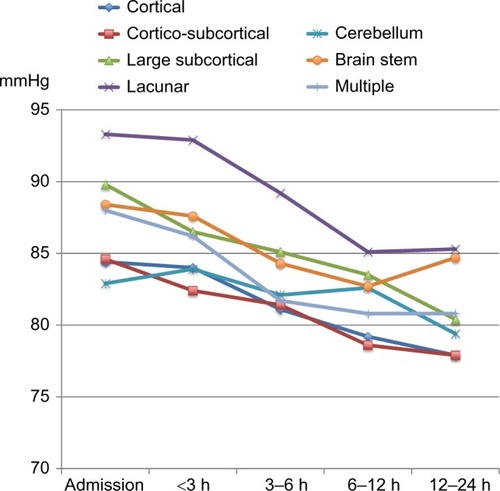
Table 1 Demographic data and clinical characteristics of the study population with ischemic stroke (n=1067)
Table 2 Mean BP and SD values on admission and <3 h, 3–6 h, 6–12 h and 12–24 h after admission
Table 3 Mean reduction in BP per time unit and differences in mean BP reduction per time unit