Figures & data
Table 1 Baseline characteristics of the included NSTE-ACS patients
Table 2 Coronary intervention data of the studied NSTE-ACS patients (N=1324)
Table 3 Logistic regression analysis of NT-proBNP, the GRACE risk score and the TIMI NSTE-ACS risk score for 30-day mortality prediction
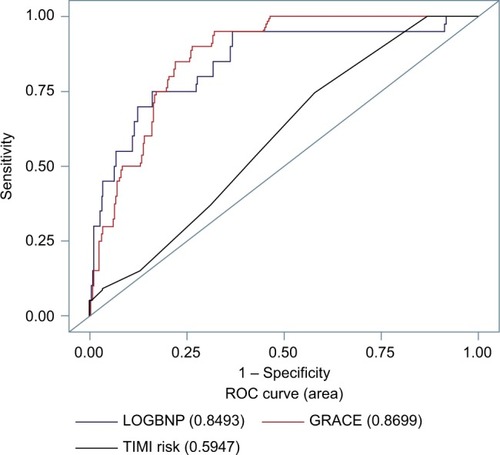
Figure 1 ROC curves for comparisons of NT-proBNP and the GRACE and TIMI-NSTE-ACS risk scores (N=692, mortality cases N=29).
Abbreviations: BNP, brain natriuretic peptide; GRACE, Global Registry of Acute Coronary Events; NT, N-terminal fragment; NSTE-ACS, non-ST-elevation acute coronary syndromes; ROC, receiver operating characteristic.