Figures & data
Figure 1 Plots of systolic (A) and diastolic (B) BP differences between the Microlife WatchBP O3® and the mean of two observer readings in 34 subjects (n=102).
Abbreviations: BP, blood pressure; DBP, diastolic blood pressure; SBP, systolic blood pressure.
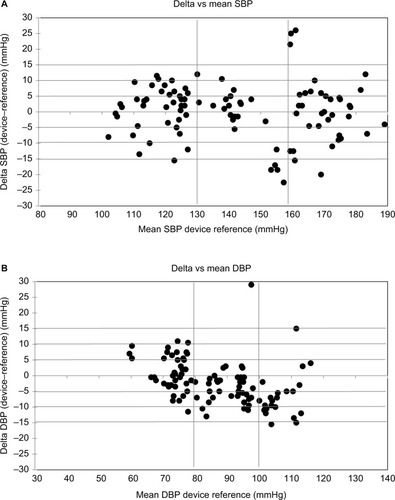
Table 1 Validation results for Microlife WatchBP O3® according to the ESH-IP 2010
Figure 2 Plots of systolic (A) and diastolic (B) BP differences between the Omron RS6® and the mean of two observer readings in 34 subjects (n=102).
Abbreviations: BP, blood pressure; DBP, diastolic blood pressure; SBP, systolic blood pressure.
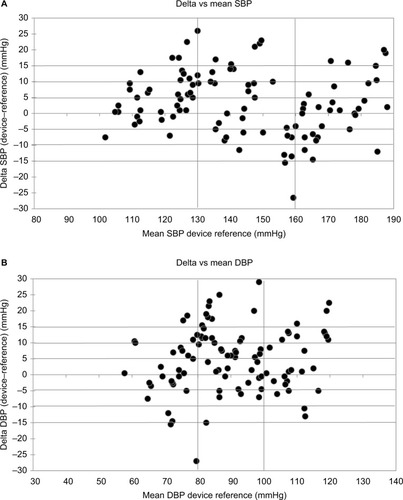
Table 2 Validation results for Omron RS6® according to the ESH-IP 2010
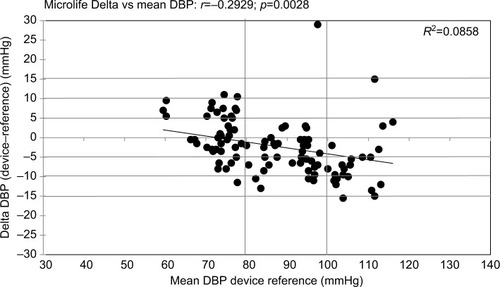
Figure 3 Correlation between the differences in DBP measured by Microlife WatchBP O3® device and the mercury sphygmomanometer and the mean average of DBP values in the total population (34 participants). “r”, Pearson’s correlation coefficient; p value is considered statistically significant when p<0.05.