
Figures & data
Table 1 Clinical characteristics of 50 patients operated with LABFB
Table 2 Scale reliability and homogeneity estimates of SF-36 response at all time points (preoperative, 1, 3 and 6 months postoperatively) in 50 patients operated with laparoscopic aortobifemoral bypass for TASC II type D lesions
Figure 1 Changes in the scores (observed mean values) of individual domains in the SF-36, in 50 patients before and after laparoscopic aortobifemoral bypass for the treatment of aortoiliac occlusive disease (Trans Atlantic Inter-Society Consensus II, type D lesions).
Abbreviations: BP, bodily pain; GH, general health; MCS, mental component score; MH, mental health; PF, physical functioning; PCS, physical component score; RP, role limitations due to physical problems; RE, role limitations due to emotional problems; SF, social functioning; SF-36, Short-Form 36; VT, vitality.
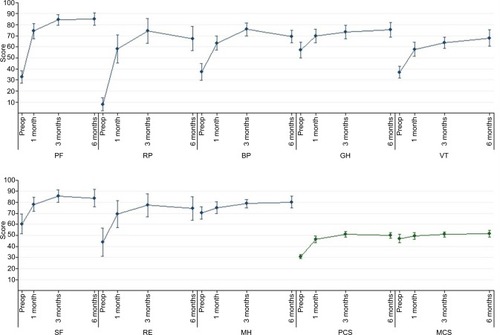
Table 3 Results of the linear mixed-effect regression analysis (univariate and multivariate) of the physical component of the SF-36, PF, at 1, 3 and 6 months after laparoscopic aortobifemoral bypass of 50 patients for aortoiliac occlusive disease, TASC II, type D lesions
Table 5 Results of the linear mixed-effect regression analysis (univariate and multivariate) of the physical component of the SF-36, bodily pain, at 1, 3 and 6 months after laparoscopic aortobifemoral bypass of 50 patients for aortoiliac occlusive disease, TASC II, type D lesions
Table 4 Results of the linear mixed-effect regression analysis (univariate and multivariate) of the physical component of the SF-36, role physical, at 1, 3 and 6 months after laparoscopic aortobifemoral bypass of 50 patients for aortoiliac occlusive disease, TASC II, type D lesions
Table 6 Results of the linear mixed-effect regression analysis (univariate and multivariate) of PCS at 1, 3 and 6 months after laparoscopic aortobifemoral bypass of 50 patients for aortoiliac occlusive disease, TASC II, type D lesions
Table 7 Results of the linear mixed-effect regression analysis (univariate and multivariate) of MCS at 1, 3 and 6 months after laparoscopic aortobifemoral bypass of 50 patients for aortoiliac occlusive disease, TASC II, type D lesions