
Figures & data
Table 1 Patients’ characteristics
Table 2 Correlations between endothelial dysfunction and variable parameters
Figure 1 Reactive hyperemia index in the lumbar sympathectomy group and in the conservative treatment group.
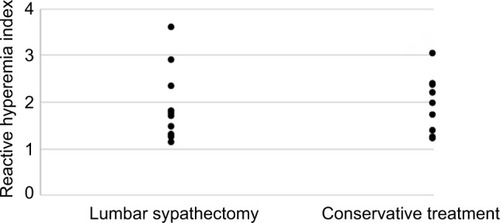
Table 3 Comparisons of patients’ characteristics
Figure 2 The correlation between ankle brachial pressure index and reactive hyperemia index in the lumbar sympathectomy group.
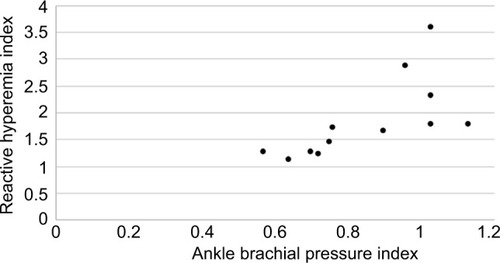
Table 4 The correlations between ankle brachial pressure index and reactive hyperemia index