
Figures & data
Table 1 Study protocol
Table 2 Baseline characteristics of patient groups (mean±SE, n (%))
Figure 1 Dynamics of office SBP, DBP, and HR on therapy in groups: #Significant in comparison with baseline in the same group. *Significant in comparison with group of patients without IHD at the same period.
Abbreviations: DBP, diastolic blood pressure; HR, heart rate; IHD, ischemic heart disease; SBP, systolic blood pressure.
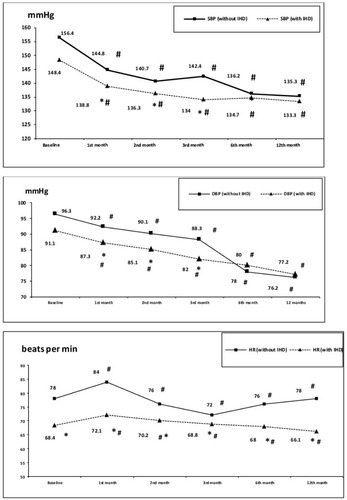
Figure 2 Lowering of 24-hour, daytime, and nighttime SBP and DBP in the treatment groups.
Abbreviations: DBP, diastolic blood pressure; IHD, ischemic heart disease; SBP, systolic blood pressure.
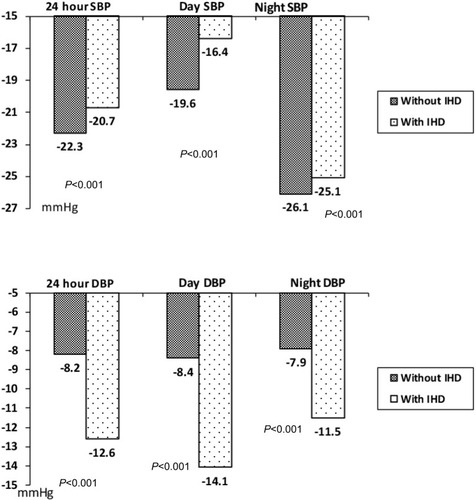
Table 3 Dynamics of ABPM patterns in the patient groups
Figure 3 Dynamics of central SBP and Aix@75 in the treatment groups.
Abbreviations: Aix@75, augmentation index adjusted to heart rate 75; IHD, ischemic heart disease; SBP, systolic blood pressure.

Table 4 Dynamics of TOD patterns in the treatment groups
Table 5 Studies evaluating the effects of high BP variability on TOD and cardiovascular events