
Figures & data
Table 1 Demographics and clinical characteristics of patients and controls
Figure 1 Color Doppler estimation of CIMT in a psoriatic patient (1.2 mm on left side and 1.6 mm on the right side).
Abbreviation: CIMT, carotid intima-media thickness.
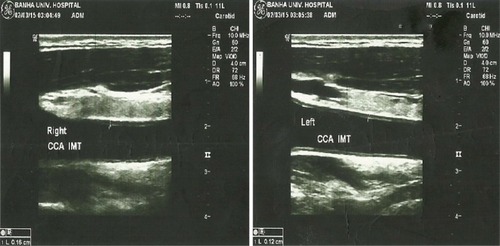
Figure 2 Patients distribution according to grades of CIMT thickness and its laterality.
Abbreviation: CIMT, carotid intima-media thickness.
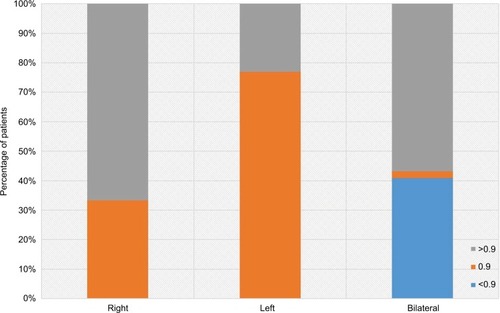
Figure 3 Mean serum pentraxin 3 and MPO levels estimated in patients and controls.
Abbreviation: MPO, myeloperoxidase.
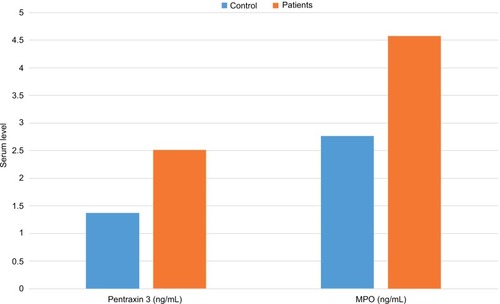
Figure 4 Mean serum endocan and 1,25(OH)2D3 levels estimated in patients and controls.
Abbreviation: 1,25(OH)2D3, 1,25-dihydroxyvitamin D3.
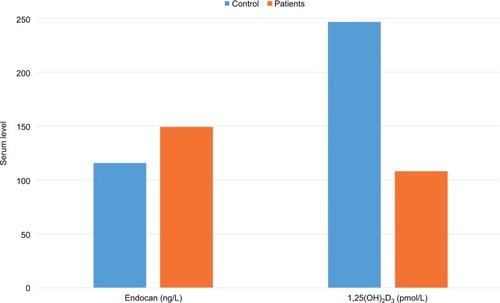
Table 2 Laboratory parameters estimated in patients compared to controls
Table 3 Correlation between determined CIMT and clinical and laboratory findings
Table 4 Regression analysis to predict for high CIMT as a measure for atherosclerosis