Figures & data
Table 1 Baseline characteristics of study participants by sex
Table 2 Characteristics of HIV infection in participants
Table 3 Classification of ABI, symptoms and ARV by sex among study participants
Table 4 Comparison of different variables of study participants according to ABI
Table 5 Crude and adjusted ORs of factors associated with PAD
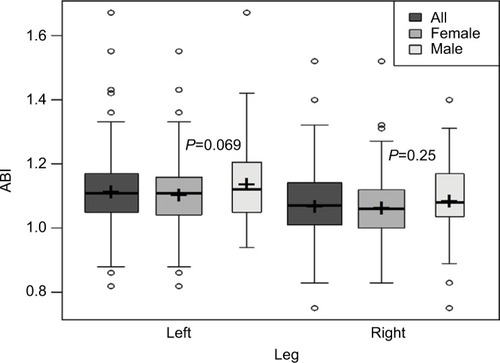
Figure 1 Comparison of ABI between males and females. The midline of the boxes represents the median and the lower and upper margins represent the 25th and 75th percentiles, respectively.
Notes: The lower and upper ends represent the minimum and maximum values, respectively, and the central dot represents the mean. It should be noted that the P-values denote the level of significance between males and females and does not involve the “All”.
Abbreviation: ABI, ankle-brachial index.
Abbreviation: ABI, ankle-brachial index.