
Figures & data
Figure 1 Schema of study protocol.
Abbreviations: ABI, ankle branchial pressure index; BT, blood test; EPA, eicosapentaenoic acid; IC, informed consent; M, months; ST, special test.
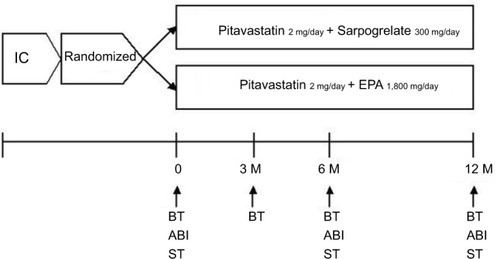
Table 1 Demographic and clinical characteristics of the T2DM patients and nondiabetic controls
Table 2 Multiple regression analysis of ABI in T2DM patients
Figure 2 Changes in ABI, BMI, HbA1c, IL-6 and MCP-1 in response to treatment with PS or PE in T2DM patients.
Notes: Bars show the mean±SD. 0: before; M: months (after). P-values are for comparison with each baseline parameter (0 vs 6 and 12 months). ANOVA (PS vs PE).
Abbreviations: ABI, ankle brachial pressure index; ANOVA, analysis of variance; BMI, body mass index; HbA1c, hemoglobin A1c; IL-6, interleukin-6; MCP-1, monocyte chemoattractant protein-1; NS, nonsignificant; PE, pitavastatin with eicosapentaenoic acid; PS, pitavastatin with sarpogrelate; T2DM, type 2 diabetes mellitus.
Abbreviations: ABI, ankle brachial pressure index; ANOVA, analysis of variance; BMI, body mass index; HbA1c, hemoglobin A1c; IL-6, interleukin-6; MCP-1, monocyte chemoattractant protein-1; NS, nonsignificant; PE, pitavastatin with eicosapentaenoic acid; PS, pitavastatin with sarpogrelate; T2DM, type 2 diabetes mellitus.
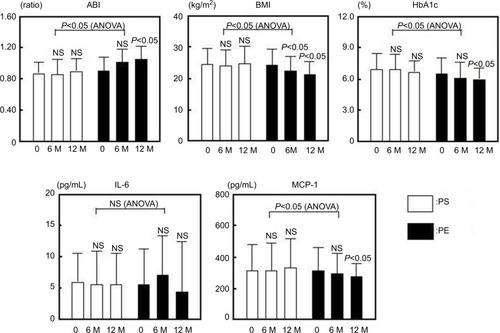
Figure 3 Changes in sE-selectin, sVCAM-1, PAI-1, PDMP and adiponectin in response to treatment with PS or PE of T2DM patients.
Notes: Bars show the mean±SD. 0: before M: months (after). P-values are for comparison with each baseline parameter (0 vs 6 and 12 months). ANOVA (PS vs PE).
Abbreviations: ANOVA, analysis of variance; NS, nonsignificant; PAI-1, plasminogen activator inhibitor-1; PDMP, platelet-derived microparticle; sE-selectin, soluble E-selectin; sVCAM-1, soluble vascular cell adhesion molecule 1; PE, pitavastatin with eicosapentaenoic acid; PS, pitavastatin with sarpogrelate; T2DM, type 2 diabetes mellitus.
Abbreviations: ANOVA, analysis of variance; NS, nonsignificant; PAI-1, plasminogen activator inhibitor-1; PDMP, platelet-derived microparticle; sE-selectin, soluble E-selectin; sVCAM-1, soluble vascular cell adhesion molecule 1; PE, pitavastatin with eicosapentaenoic acid; PS, pitavastatin with sarpogrelate; T2DM, type 2 diabetes mellitus.
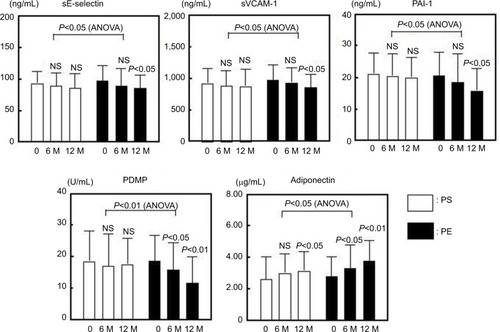
Table 3 Demographic and clinical characteristics of the PS and PE groups