Figures & data
Table 1 Patient group description (variable means together with their empirical SDs)
Figure 1 Optimal penalty parameter λ has been determined via 10-fold cross-validation.
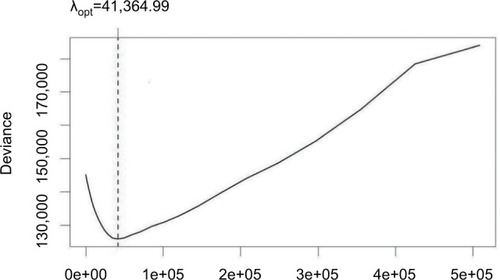
Figure 2 Coefficient paths vs the penalty parameter λ (dashed vertical line: optimal penalty parameter l).
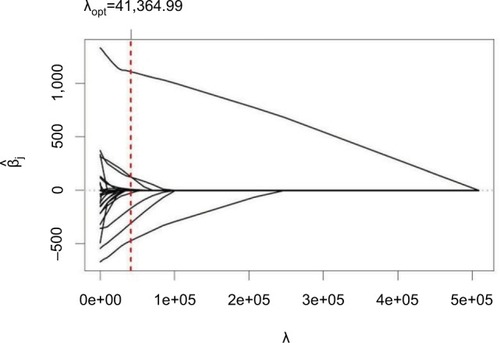
Table 2 Estimated coefficients of the linear regression effects on steps/day obtained by an additive model with a nonlinear effect for BMI
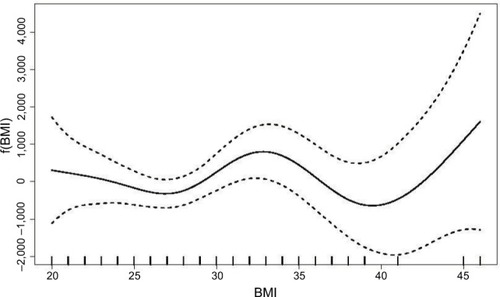
Figure 3 Nonlinear effect of BMI on step outcome.
Abbreviation: BMI, body mass index.