Figures & data
Figure 1 Flowchart of the study population.
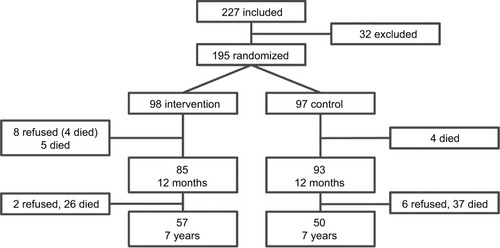
Table 1 Baseline characteristics and risk factors at 12 months
Figure 2 Kaplan–Meier survival curves for (A) the intention-to-treat and (B) complete case population.
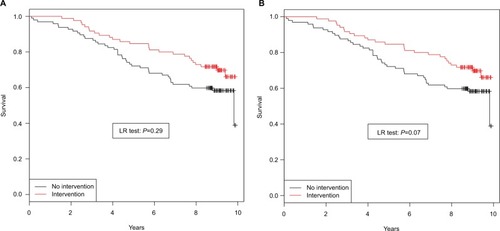
Table 3 Causes of death during follow-up
Table 2 Cox regression; death in relation to intervention, cardiovascular risk factors, stroke subtypes, and functional and cognitive assessment
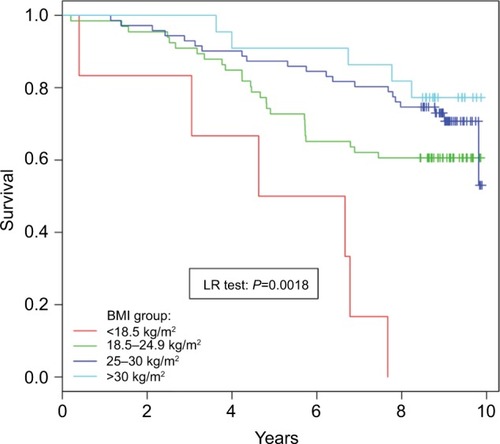
Figure 3 Kaplan–Meier survival curves of calculated body mass index groups.