
Figures & data
Table 1 Clinical characteristics of patients according to severity of coronary artery calcification
Figure 1 Mean lipid levels within each cluster presented as grouped barplots in no coronary calcification (0), mild coronary calcification (1), and severe coronary calcification (2). Positive mode data were obtained from lipidomics (UHPLC-MS) platforms. Error bars show Tukey-adjusted 95% CIs (*p=0.002 for the post-hoc test between subgroup 0 and 2).
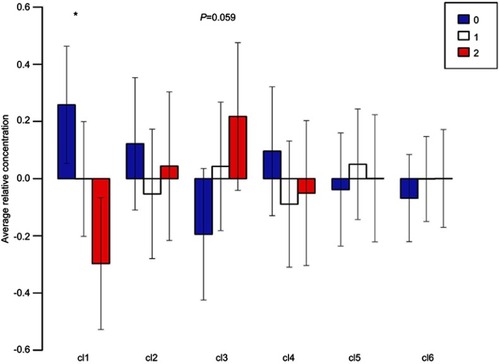
Table 2 Identified lipids in main lipid classes with their corresponding subclasses
Figure 2 Differences in triacylglycerol medians between SCC vs NCC, SCC vs MCC and MCC vs NCC. Data were log2-transformed previous to calculation.*p-value (unpaired t-test)<0.05. **p-value of logistic regression model adjusted for age, sex, and statin treatment <0.05.
Figure S1 PCA) score plots of: (A) PCA on negative mode of no coronary calcification (0), mild coronary calcification (1), and severe coronary calcification (2) groups. (B) PCA on negative mode data with NCC and SCC groups. (C) PCA on positive mode of NCC, MCC,and SCC groups. (D) PCA on positive mode of NCC and SCC.
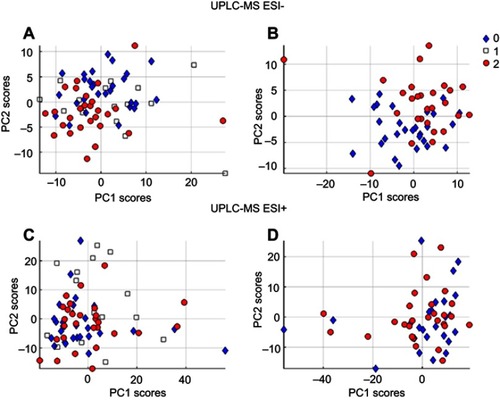
Table S1 Identified lipids in main lipid classes with their corresponding subclasses
Table S2 Statistics for OPLS-DA models of NCC vs SCC and MCC vs SCC using the negative mode data.
Table S3 Description of lipid clusters obtained from positive mode data