Figures & data
Figure 1 Median percent change in high-density lipoprotein particle number from baseline after 12 weeks of treatment with NER/S combination therapy or atorvastatin monotherapy. P value is from the Wilcoxon rank-sum test and is shown for significant comparison between NER/S combination therapy and atorvastatin monotherapy. The interquartile ranges (Q1, Q3) for the percent changes shown are as follows. Total HDL particles (−1.4%, 24.4%) for NER/S and (−0.6%, 15.9%) for atorvastatin; small HDL particles (−16.8%, 8.8%) for NER/S and (−6.3%, 17.5%) for atorvastatin; medium HDL particles (−74.3%, 194.3%) for NER/S and (−75.7%, 117.8%) for atorvastatin; large HDL particles (32.2%, 176.9%) for NER/S and (4.2%, 167.7%) for atorvastatin.
Abbreviations: HDL, high-density lipoprotein; NMR, nuclear magnetic resonance; NER/S, extended-release niacin-simvastatin; N, number of patients.
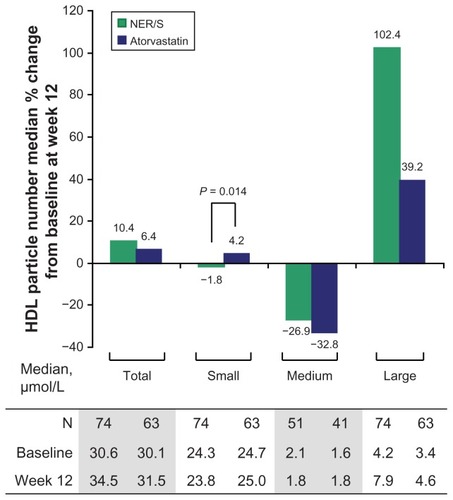
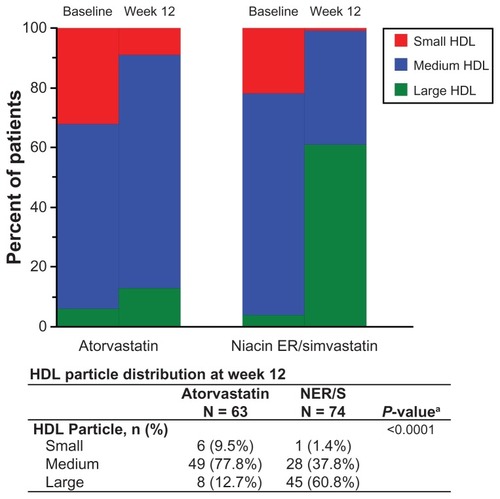
Figure 2 Distribution of HDL particles in groups treated with NER/S (2000/40 mg/day) combination therapy and atorvastatin monotherapy (40 mg/day) at baseline and week 12. The difference in HDL particle size distribution at week 12 between NER/S and atorvastatin after adjusting for HDL particle size at baseline is highly significant (P < 0.0001). Size ranges of HDL particle subclasses were large (8.8–13 nm), medium (8.2–8.8 nm), and small (7.3–8.2). The P valuea is from the Cochran–Mantel–Haenszel test and is shown for significant comparison in HDL particle size distribution between NER/S combination therapy and atorvastatin monotherapy.