Figures & data
Table 1 Characteristics of Controls and DVT Cases
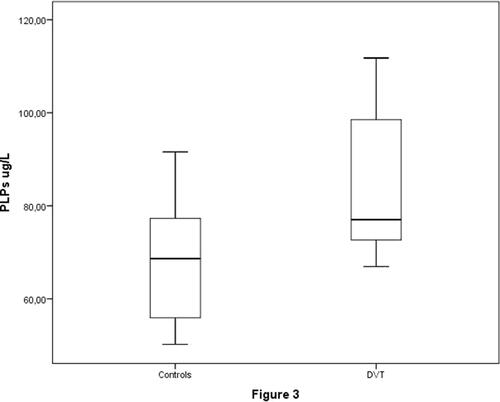
Figure 1 Box-plot showing the distribution of microparticle (MP) quantification by controls and DVT cases.
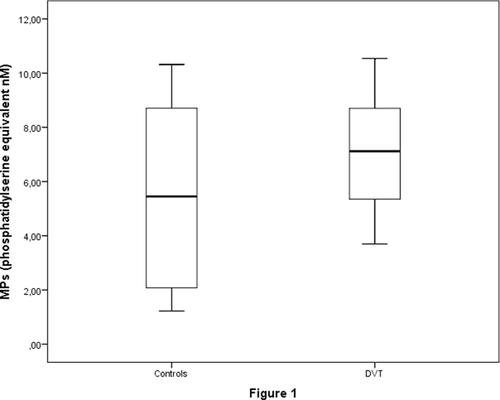
Figure 2 Box-plot showing the distribution of prothrombinase-induced clotting time assay (PiCT) velocity by controls and DVT cases. The asterisks are outliers, and the dots are extreme values. The numbers identify the sample to which the asterisk or dot refers.
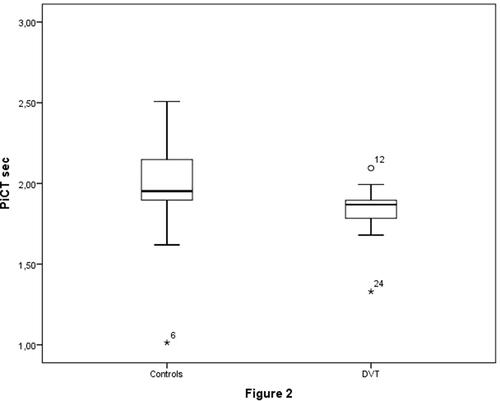
Figure 3 Box-plot showing the distribution of phospholipid (PLP) quantification by controls and DVT cases.