Figures & data
Figure 1 Schematic diagram of the adaptable blood pressure system. For blood pressure assessments, participants sit upright on the health kiosk facing the screen and insert their left arm through the mechanical cuff, resting their elbow and forearm on the support. The adapted knuckle support provides four degrees freedom of movement for comfortable postural positioning. Upon initiation, a motorized gearhead wraps the mechanical cuff down to the user’s arm prior to bladder inflation. The cuff then operates like a normal automated blood pressure system, detecting blood pressure pulses as it deflates. Once the BP assessment is completed, the cuff fully deflates and expands, returning to the circumference of the starting position.
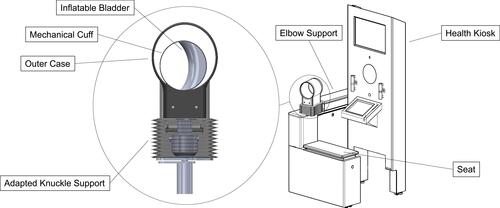
Table 1 Participant Characteristics and ANSI/AAMI/ISO 81060–2:2013 Requirements
Figure 2 Flow diagram of participants through recruitment, testing, and analysis. The 85 participants included in the final analyses each had 3 paired determinations considered valid according to ANSI/AAMI/ISO 81060–2:2013 standards.
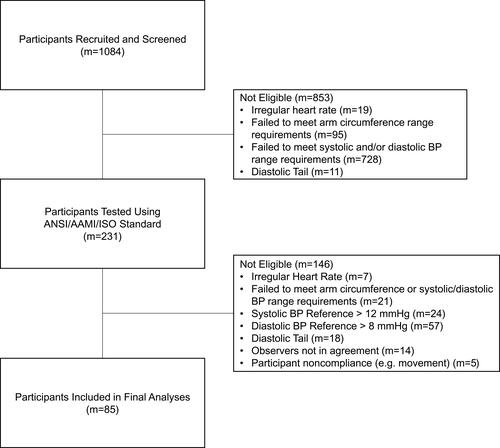
Table 2 Validation Results for ANSI/AAMI/ISO 81060–2:2013
Figure 3 Bland–Altman plots of 255 paired determinations (n = 255). (A) Systolic pressures: differences versus means, (B) Diastolic pressures: differences versus means. Differences were calculated by subtracting valid ABPS BP measurements by their corresponding reference BP measurements. Means were calculated using valid ABPS BP measurements and their corresponding reference BP measurements. Indications for mean (X̄n) ± 2Sn are shown.
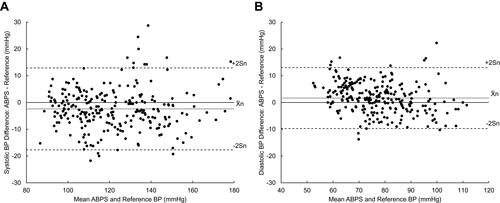
Figure 4 Plots of mean (A) systolic and (B) diastolic BP difference versus NHANES arm circumference (m = 85). Differences were calculated by subtracting valid ABPS BP measurements by their corresponding reference BP measurements. The average of three BP differences for each of the 85 participants is plotted against the participant’s arm circumference measured by the NHANES method. Indications for mean (X̄m) ± 2Sm are shown.
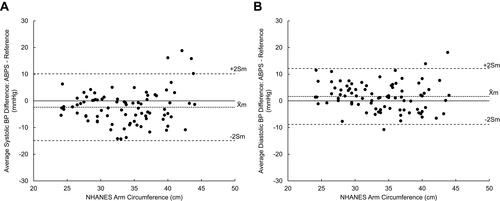
Figure 5 Bland–Altman plots of 217 participants’ arm circumference. (A) NHANES arm circumference is plotted against the average of three ABPS arm circumference measurements. A reference line (y = x) is included. (B) Bland–Altman plots of ABPS arm circumference difference versus mean of ABPS and NHANES. Differences were calculated by subtracting the average of three ABPS arm circumference measurements by their corresponding NHANES measurement. Indications for mean (X̄c) ± 2Sc are shown.
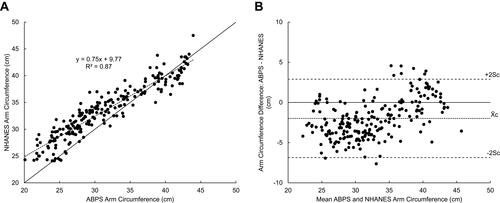
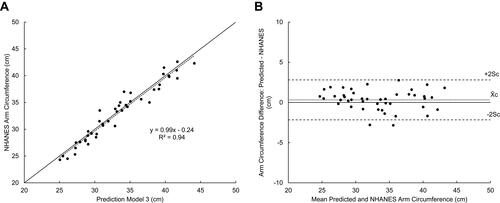
Figure 6 New prediction model (Model 3) accuracy for 44 participants in the holdout dataset. (A) NHANES arm circumference is plotted against the Model 3 predicted arm circumferences. A reference line (y = x) is included. (B) Bland–Altman plots of predicted arm circumference difference versus mean of predicted and NHANES. Differences were calculated by subtracting the Model 3 predicted arm circumferences by their corresponding NHANES measurements. Indications for mean (X̄c) ± 2Sc are shown.