Figures & data
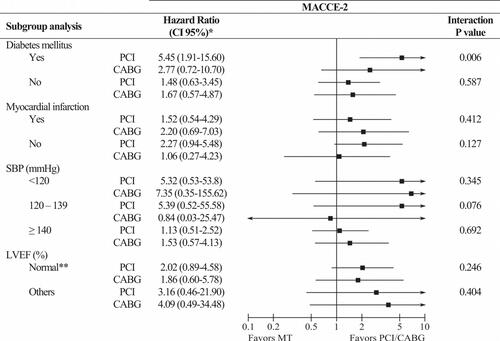
Figure 1 Study flowchart. PCI, percutaneous coronary intervention; CABG, coronary artery bypass grafting; CAD, coronary artery disease; MACCE, major adverse cardiac and cerebral events, as defined in Methods section.
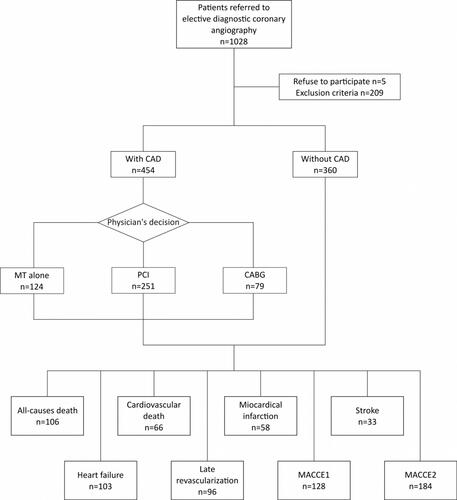
Table 1 Baseline Clinical and Angiographic Characteristics
Table 2 Major Clinical Outcomes According to the Treatment of the Patients
Figure 2 Event-free survival curves for all-cause death, cardiovascular death, MACCE-1, and MACCE-2 adjusted for age, sex, school degree, BMI, DM, hypertension, chest pain, HDL-C, creatinine, hs-CRP, smoking, HF, LVEF, MI before the index procedure and SXscore. CABG, coronary-artery bypass grafting; MT, medical-therapy; PCI, percutaneous coronary intervention. Abbreviations as in .

Table 3 Cox Regression Analysis to Evaluate the Effect of the Treatment on the Outcomes After Diagnostic Coronary Angiography with Adjustment for Confounding Factors
Figure 3 Hazard ratio for MACCE-2 in participants stratified by diabetes mellitus, myocardial infarction, categories of systolic blood pressure, and left ventricular ejection fraction. *Adjusted for model 3 as. . **Normal for male ≥ 52% and for female ≥ 54%. Abbreviations as in .