
Figures & data
Figure 1 CTA sagittal plane of a patient with MALS taken in deep expiration. An external compression of the celiac artery and a normal anatomy of the superior mesenteric artery is demonstrated.
Abbreviations: MALS, median arcuate ligament syndrome; CTA, computed tomography angiography.
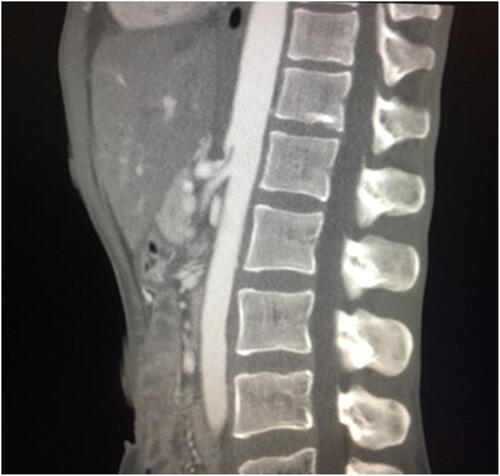
Figure 2 Measurement points in the stomach and duodenum in the study of perioperative microcirculatory changes in patients with MALS.
Abbreviation: MALS, median arcuate ligament syndrome.
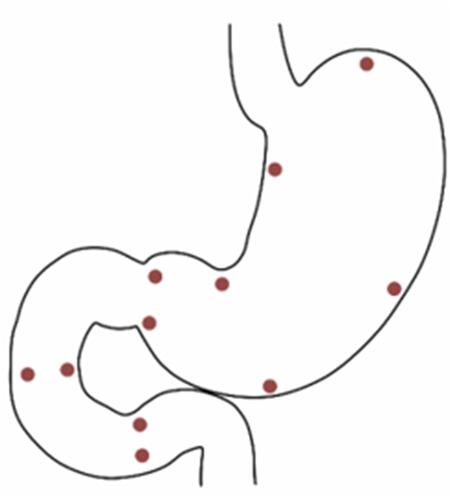
Table 1 Patient Characteristics in the Study on Visible Light Spectroscopy and Laser Doppler Flowmetry During Upper Endoscopy in Patients with Median Arcuate Ligament Syndrome
Figure 3 Flow chart of the inclusion process and outcomes in the study of perioperative microcirculatory changes in patients with MALS.
Abbreviations: MALS, median arcuate ligament syndrome; CMI, chronic mesenteric ischemia.
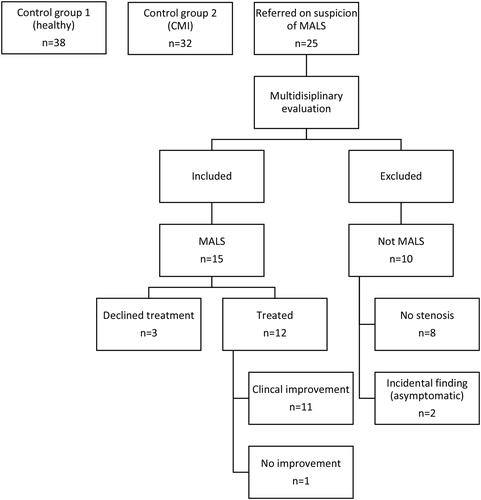
Table 2 Baseline Characteristics of Patients with MALS and Control Subjects with Normal Intestinal Circulation (CG1), and Control Subjects with Chronic Mesenteric Ischemia (CMI, CG2)
Table 3 Mean Values of Combined Arterial and Venous Oxygen Saturation (SO2), Relative Hemoglobin Amount (rHb), Flow and Velocity for the Three Examined Areas in the Stomach and Duodenum, and a Mean of All Areas in Patients with MALS, CG1 and CG2. SO2 in Percent. Relative Hemoglobin Amount, Flow and Velocity in Arbitrary Units
Figure 4 Box-plot of preoperative combined arterial and venous oxygen saturation in CG1 (n=38), CG2 (CMI, n=32) and patients with MALS (n=11). The thick black line represents the median, the blue box represents the 25–75th percentile and the bars are minimum and maximum points (excluding outliers).
Abbreviations: CG1, control group 1; CG2, control group 2; CMI, chronic mesenteric ischemia; MALS, median arcuate ligament syndrome.
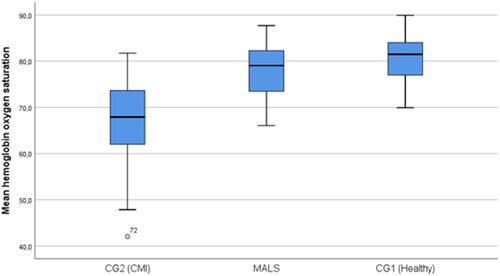
Figure 5 ROC curve of a mean of all measurements of saturation in both the stomach and duodenum in patient with MALS (n=11) compared to CG1 (n=38).
Abbreviations: ROC, receiver operated characteristics; MALS, median arcuate ligament syndrome; CG1, control group 1; AUC, area under the curve; CMI, chronic mesenteric ischemia.
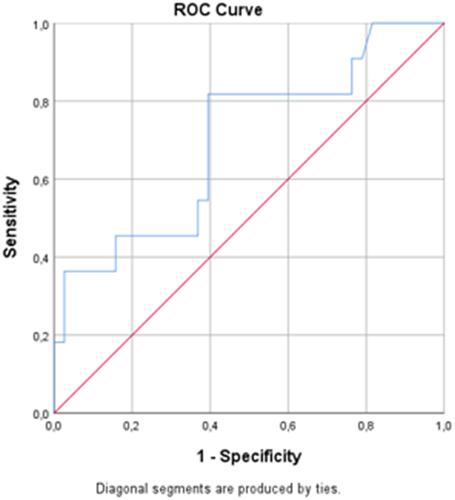
Table 4 Combined Arterial and Venous Oxygen Saturation (SO2), Relative Hemoglobin Amount (rHb), Flow and Velocity Before and After Laparoscopic Decompression of the Celiac Artery in Patients with Median Arcuate Ligament Syndrome
Figure 6 Combined arterial and venous oxygen saturation (%), before and after (n=11, p=0.05) laparoscopic decompression of the CA in patients with MALS. Each line represents one patient.
Abbreviations: MALS, median arcuate ligament syndrome; CA, celiac artery.
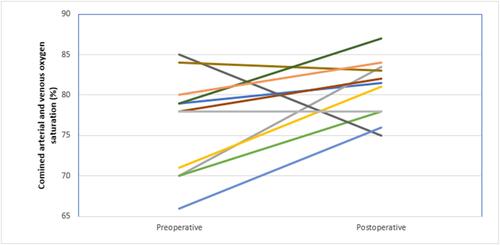
Table 5 Pre- and Post-Intervention Demographics and Characteristics in Patients with Median Arcuate Ligament Syndrome