
Figures & data
Figure 1 Measurement of the interval between the peak and the end of the T wave (Tp-e).
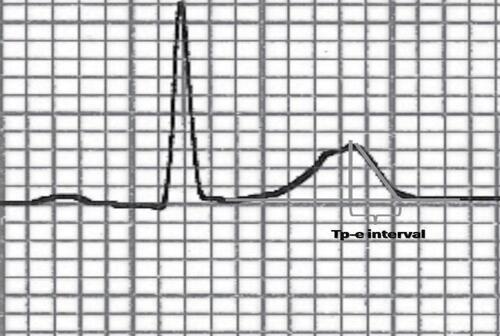
Table 1 Biological and Laboratory Parameters of the Study Population
Table 2 Clinical and Electrocardiographic Variables of the Study Population
Table 3 Biological and Laboratory Parameters of the Study Population Characterized by Gender
Table 4 Clinical and Electrocardiographic Variables of the Study Population Characterized by Gender
Table 5 Linear Regression in the Sickle Cell Anemia Population (PAI-1 and QTc)
Table 6 Linear Regression in the Sickle Cell Anemia Population (BMI and Tp-e)
Table 7 Linear Regression in the Sickle Cell Anemia Population (BMI and Tp-e/QTc Ratio)