
Figures & data
Figure 1 (A–B). Transserosal microcirculation recordings: (A) microprobe on ventricle surface (B) LCD monitor with the real-time absorption spectrum of oxyhemoglobin (red), and graphic presentation of StO2, relative hemoglobin, flow and velocity and the mean numerical values.
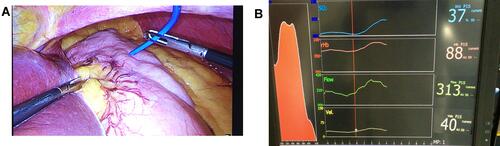
Figure 2 (A–C). Measuring points M1 to M8 (green dots) at baseline, after gastric tube construction, and gastroesophageal anastomosis.
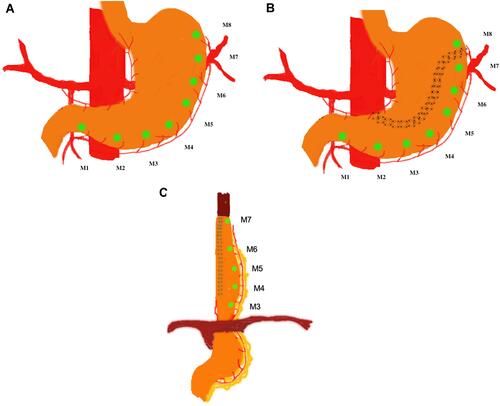
Table 1 Baseline Characteristics of Patients (n=10)
Figure 3 (A–D). Mean values with standard deviation of intraoperative transserosal microcirculation of stomach and gastric tube in patients with esophageal cancer. AU, arbitrary units; M1-M7, measuring sites.
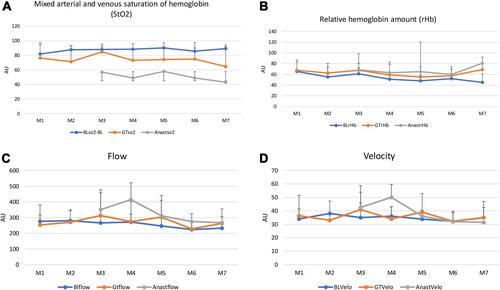
Table 2 Results of Intraoperative Transserosal Microcirculation Assessment of Gastric Tube and Thoracic Gastroesophageal Anastomosis with Laser Doppler Flowmetry and Visible Light Spectroscopy in Patients with Esophageal Cancer