
Figures & data
Figure 1 Flow diagram of patient enrollment and group allocation.
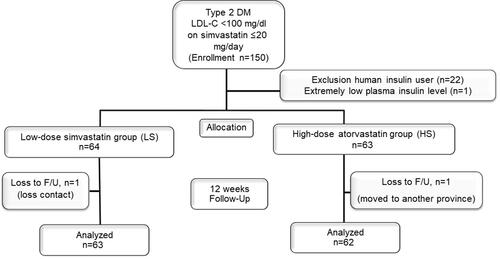
Table 1 Baseline Demographic and Clinical Characteristics of Study Patients
Table 2 Hypoglycemic Agents Used Compared Between the Two Study Groups
Table 3 Anthropometric, Glycemic, and Lipid Parameters at 6 and 12 Weeks
Figure 2 Changes from baseline to 6 and 12 weeks for (A) fasting plasma glucose (FPG); (B) glycated hemoglobin (HbA1c); (C) homeostatic model assessment of beta call function (HOMA-B); and, (D) HOMA of insulin resistance (HOMA-IR) compared between groups.
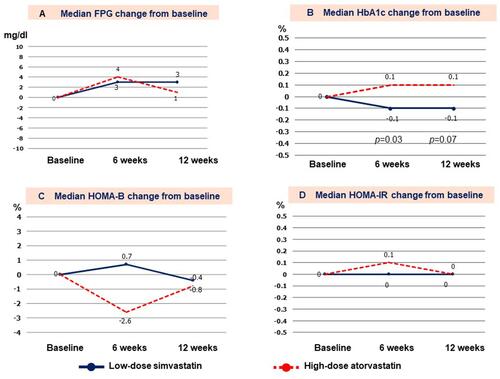
Table 4 Neurocognition Testing Scores of Study Patients. Mean Montreal Cognitive Assessment (MoCA) Score and Median Trail Making Test, Part B (TMT) Score in Seconds Compared Between Groups at All Study Time Points
Table 5 Neurocognition Testing Scores of Study Patients. Mean Change in MoCA Score and Median TMT Score in Seconds from Baseline to 6 and 12 Weeks Compared Between Groups