Figures & data
Figure 1 Population selection process.
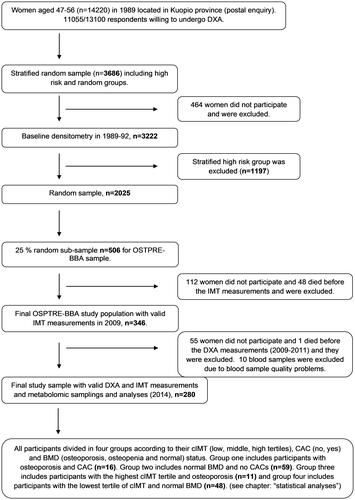
Table 1 Characteristics of the Study Population and the Subgroups
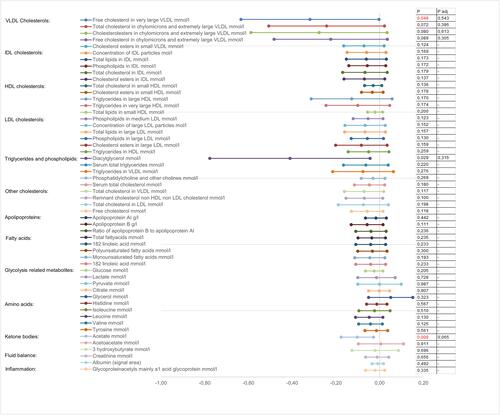
Figure 2 The differences in metabolomics between group I and group II.
Notes: The mean difference in the 95% confidence intervals between group I (n=16, osteoporosis with CACs) and group II (n=59, normal T-score and no CACs). Group II was used as a reference group. Only the five most remarkable variables (p-values) from each metabolic group are shown in the figure. Logarithm modifications were made to ensure the variables had normal distributions. P-values indicated with red color were statistically significant. P = p-value; adj = adjusted with age, total body fat mass and statin use.
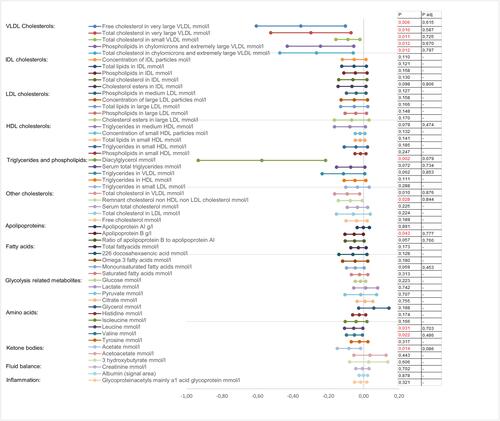
Figure 3 The differences in metabolomics between group III and group IV.
Notes: The mean difference with the 95% confidence intervals between group III (n=11, osteoporosis with highest CIMT tertile) and group IV (n=48, normal T-score and low CIMT). Group IV was used as a reference group. Only the five most remarkable variables (p-values) from each metabolic group are shown in the figure. Logarithm modifications were made to ensure variables normal distributions. P-values indicated with red color were statistically significant. P = p-value; adj = adjusted with age, total body fat mass and statin use.