
Figures & data
Figure 1 Sampling procedure of the physical activity (PA) data in the Lifestyle, Biomarkers, and Atherosclerosis Study.
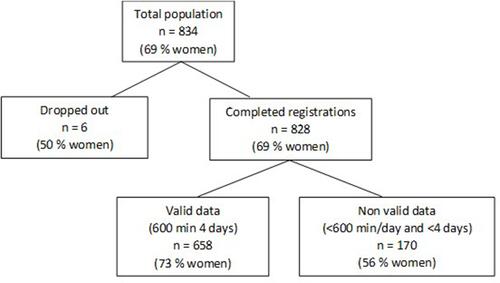
Table 1 Basic Characteristics in the Study Participants with Valid Physical Activity (PA) Data
Table 2 Distribution of Time Spent in Different Physical Activity Intensity Levels (Min/Day) and Steps per Day, in the Total Population, Divided in the Categories At Risk and Not At Risk According to Wildman’s Risk Score
Figure 2 AIx_HR75 (Augmentation index adjusted to heart rate 75 beats/min) in the moderate and vigorous physical activity (MVPA) categories not reaching 30 minutes MVPA per day (n=157), reaching 30 minutes MVPA per day (n=353), and reaching 60 minutes MVPA per day (n=144) in total population with valid physical activity data. Study participants who spent <30 minutes per day in MVPA had significantly higher AIx_HR75 than study participants who spent >60 minutes/day in MVPA, *P<0.05.
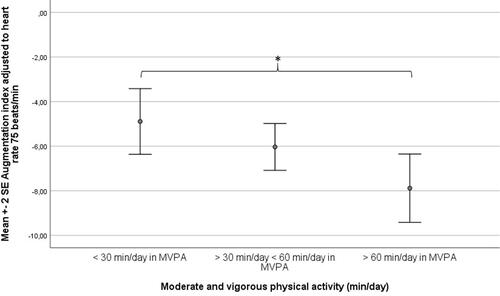
Table 3 Simple Linear Regression Coefficients (β) and Standardized β (Stand β) Between Regional Stiffness Measurements as Dependent Variables and Physical Activity Levels as Independent Variables, in Women and Men