
Figures & data
Table 1 Characteristics of the Study Population and Drug Treatments
Figure 1 Correlation between each segmental β in healthy subjects.
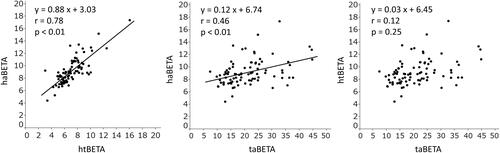
Figure 2 Correlation between each segmental β in patients with coronary artery disease.
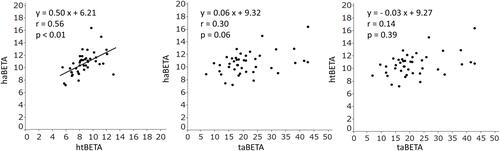
Figure 3 Multiple linear regression model for haBETA with htBETA and taBETA in healthy subjects and patients with coronary artery disease.
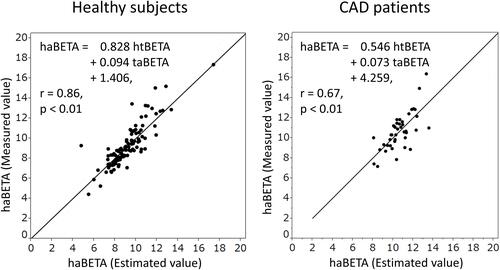
Figure 4 Principal component analysis in healthy subjects and patients with coronary artery disease. Component 1: horizontal (relationship between htBETA and haBETA). Component 2: vertical (relationship between taBETA and haBETA).
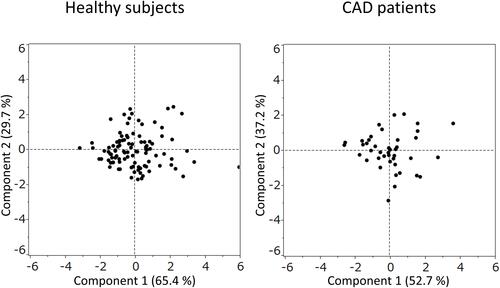
Table 2 Correlation Coefficient (r) Among htBETA, taBETA, haBETA, and Clinical Characteristics in Healthy Subjects and Patients with CAD
Figure 5 Reciever operating characteristic (ROC) curves of haBETA, htBETA, and taBETA in coronary artery disease (CAD). haBETA: cutoff value 9.20 (black arrow), sensitivity 80.5, specificity 63.3%. htBETA: cutoff value 7.72 (dark grey arrow), sensitivity 75.6, specificity 68.9%. taBETA: cutoff value 21.0 (grey arrow), sensitivity 65.6, specificity 45.6%. Each arrow indicates the optimal threshold (cutoff value) of haBETA, htBETA, and taBETA for the discernment of the presence of CAD, respectively. The area under the ROC curve (AUC ± SE) of haBETA, htBETA, and taBETA were 0.731 ± 0.046 (p < 0.01), 0.757 ± 0.043 (p < 0.01), and 0.493 ± 0.054 (p = 0.49), respectively.
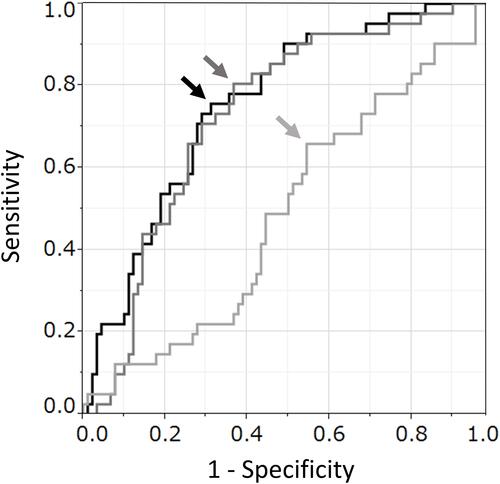
Table 3 htBETA, taBETA, and haBETA in the Healthy Subjects and Patients with CAD