Figures & data
Table 1 Baseline characteristics of the simulation and DURATION trials populations
Figure 1 Changes in A1C (A), weight (B), and systolic blood pressure (C) over 20 years of simulated treatment with high-adherence insulin, PIO, and ExQW versus moderate-adherence insulin.
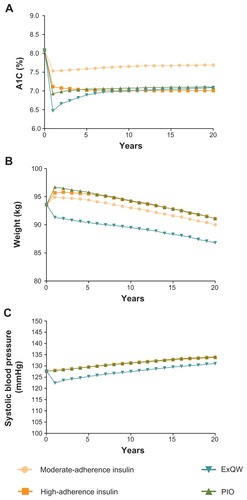
Figure 2 Changes in total cholesterol (A), high- (B) and low-density (C) lipoproteins, and triglycerides (D) over 20 years of simulated treatment with high-adherence insulin, PIO, and ExQW versus moderate-adherence insulin.
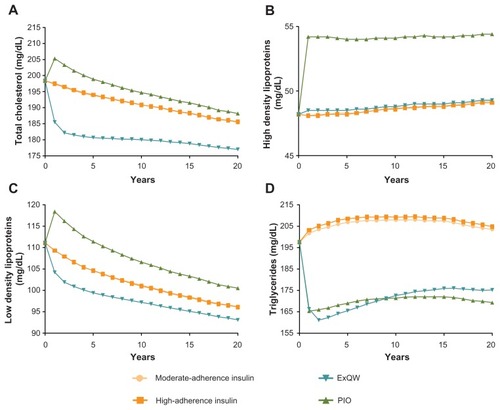
Figure 3 Changes relative to moderate-adherence insulin in Kaplan-Meier event rates of cardiovascular and microvascular complications of diabetes after 20 years of simulated treatment with high-adherence insulin, PIO, and ExQW.
Abbreviations: ExQW, exenatide once weekly; PIO, pioglitazone.
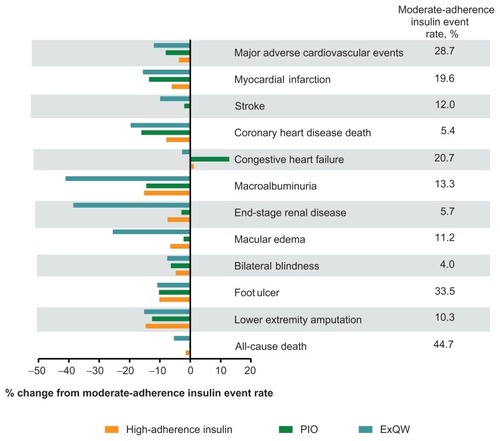
Table 2 Total life-years and costs (undiscounted) per initial person for high-adherence insulin, PIO, and ExQW vs moderate-adherence insulin after 5, 10, and 20 years of treatment
Figure 4 QALYs (undiscounted) saved versus moderate-adherence insulin per 1000 simulated patients.
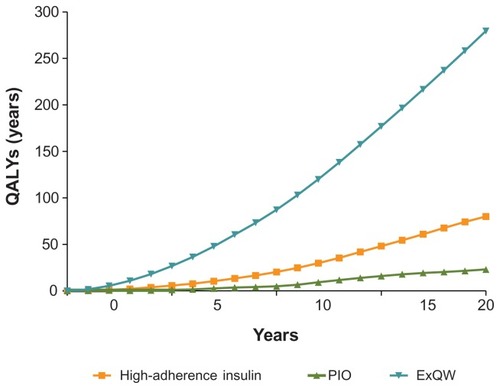
Table 3 Numbers needed-to-treat versus moderate-adherence insulin to avoid a single cardiovascular event