Figures & data
Figure 1 The function of CETP in RCT.
Notes: CETP mediates the equimolar transfer of CE and TG between atherogenic VLDL, LDL, and anti-atherogenic HDL. The majority of CE originates in HDL-C via a reaction carried out by LCAT, whereas the bulk of TG stems from the liver and intestine as VLDL or chylomicrons, respectively. LPL and HL hydrolyze a portion of TG from VLDL, which converts VLDL to LDL. Cells within the liver and peripheral tissue that express the LDL receptor take up excess LDL. In addition, macrophages also take up LDL and are converted to foam cells. Esterified and free (unesterified) cholesterol (FC) is then taken up by HDL via the SR-B1 (Pathway 1) and by LDL via the LDL-R (pathway 2). Reprinted from the Journal of the American College of Cardiology. Barter PJ, Kastelein JJ. Targeting cholesteryl ester transfer protein for the prevention and management of cardiovascular disease. J Am Coll Cardiol. 2006;47(3):492–499. Copyright© 2006, with permission from Elsevier.Citation31
Abbreviations: CE, cholesteryl ester; CETP, cholesteryl ester transfer protein; FC, free cholesterol; HDL, high-density lipoprotein; HDL-C, high-density lipoprotein cholesterol; HL, hepatic lipase; LCAT, lecithin cholesterol acyltransferase; LDL, low-density lipoprotein; LDL-R, low-density lipoprotein receptor; LPL, lipoprotein lipase; RCT, reverse cholesterol transport; SR-B1, scavenger receptor-B1; TG, triglyceride; VLDL, very low-density lipoprotein.
Abbreviations: CE, cholesteryl ester; CETP, cholesteryl ester transfer protein; FC, free cholesterol; HDL, high-density lipoprotein; HDL-C, high-density lipoprotein cholesterol; HL, hepatic lipase; LCAT, lecithin cholesterol acyltransferase; LDL, low-density lipoprotein; LDL-R, low-density lipoprotein receptor; LPL, lipoprotein lipase; RCT, reverse cholesterol transport; SR-B1, scavenger receptor-B1; TG, triglyceride; VLDL, very low-density lipoprotein.
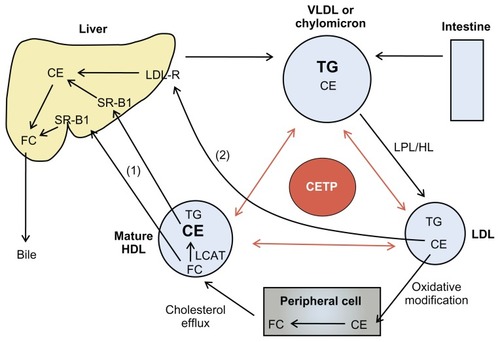
Figure 2 Changes in LDL-C over time. (A) anacetrapib monotherapy versus placebo and (B) anacetrapib + atorvastatin 20 mg versus atorvastatin 20 mg.
Note: Reprinted from the American Heart Journal. Bloomfield D, Carlson GL, Sapre A, et al. Efficacy and safety of the cholesteryl ester transfer protein inhibitor anacetrapib as monotherapy and coadministered with atorvastatin in dyslipidemic patients. Am Heart J. 2009;157:352–360. Copyright© 2009, with permission from Elsevier.Citation52
Abbreviation: LDL-C, low-density lipoprotein cholesterol.
Abbreviation: LDL-C, low-density lipoprotein cholesterol.
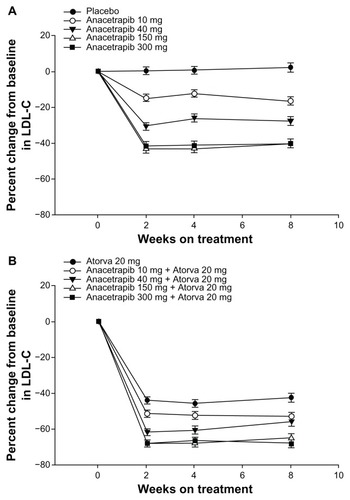
Figure 3 Changes in HDL-C over time. (A) Anacetrapib monotherapy versus placebo and (B) anacetrapib + atorvastatin 20 mg versus atorvastatin 20 mg.
Note: Reprinted from the American Heart Journal. Bloomfield D, Carlson GL, Sapre A, et al. Efficacy and safety of the cholesteryl ester transfer protein inhibitor anacetrapib as monotherapy and coadministered with atorvastatin in dyslipidemic patients. Am Heart J. 2009;157:352–360. Copyright© 2009, with permission from Elsevier.Citation52
Abbreviation: HDL-C, high-density lipoprotein cholesterol.
Abbreviation: HDL-C, high-density lipoprotein cholesterol.
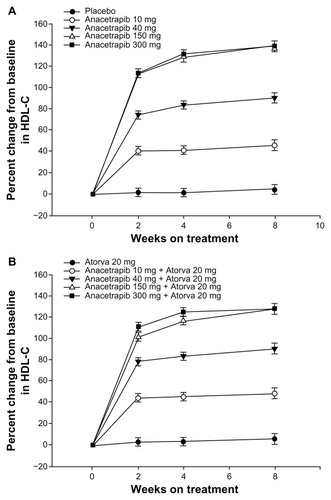
Figure 4 Changes in systolic and diastolic blood pressure at week 8 with anacetrapib monotherapy versus placebo.
Note: Reprinted from the American Heart Journal. Bloomfield D, Carlson GL, Sapre A, et al. Efficacy and safety of the cholesteryl ester transfer protein inhibitor anacetrapib as monotherapy and coadministered with atorvastatin in dyslipidemic patients. Am Heart J. 2009;157:352–360. Copyright© 2009, with permission from Elsevier.Citation52
Abbreviations: LS, least squares; SE, standard error.
Abbreviations: LS, least squares; SE, standard error.
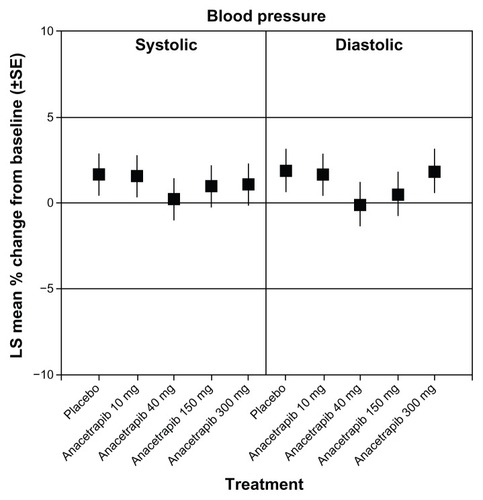
Figure 5 Changes in cholesterol levels during the study period.
Notes: LDL-C and HDL-C levels in the anacetrapib and placebo groups from baseline to week 76. Horizontal bars indicate standard error. To convert the values for LDL-C and HDL-C to mmol/L, multiply by 0.02586. Reprinted from Cannon CP, Shah S, Dansky HM, et al. Determining the Efficacy and Tolerability Investigators. Safety of anacetrapib in patients with or at high risk for coronary heart disease. N Engl J Med. 2010;363(25):2406–2415. Copyright© 2010, Massachusetts Medical Society. Reprinted with permission from Massachusetts Medical Society.Citation56
Abbreviations: HDL-C, high-density lipoprotein cholesterol; LDL-C, low-density lipoprotein cholesterol.
Abbreviations: HDL-C, high-density lipoprotein cholesterol; LDL-C, low-density lipoprotein cholesterol.
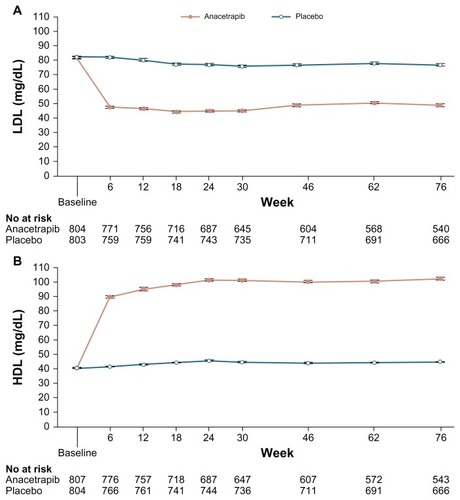
Table 1 Cardiovascular Events during the Treatment Phase of the StudyTable Footnote*