Figures & data
Figure 1 Exemplary FMSF traces recorded for two individuals: (A) highly trained athlete with very high sensitivity to hypoxia (male, age 24 y., long-distance runner), (B) diabetes type 2 patient with very low sensitivity to hypoxia (male, age 70 y., disease duration 20 y., retinopathy, neuropathy). Relative contribution to the low-frequency oscillations: endo-endothelial, neuro-neurogenic and myo-myogenic.
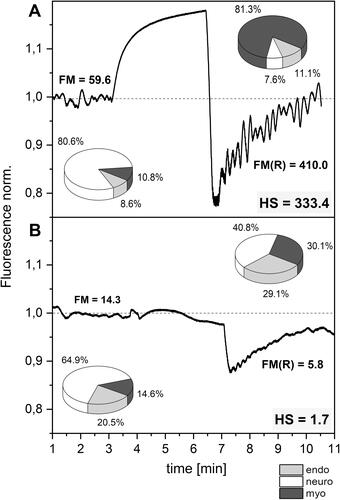
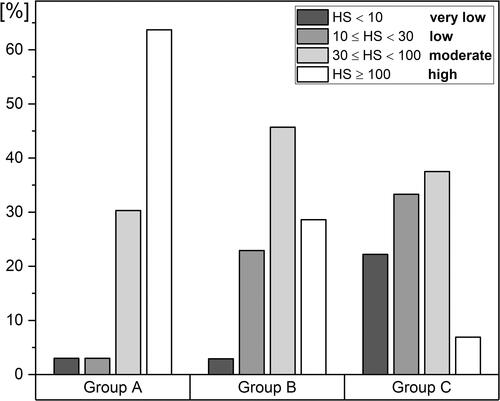
Figure 2 Distribution of the HS parameter in groups (A–C) (A) highly trained athletes, n = 33 (26 m, 7 f), mean age 22.5 (16–35 y.), (B) healthy middle-aged individuals, n = 35 (22 m, 13 f), mean age 38.5 (30–50 y.), (C) diabetes type 2 patients, n = 72 (40 m, 32 f), mean age 62 (50–80 y.). The statistical significance of differences between parameters for the compared groups (Kruskal–Wallis test): A vs B, p < 0.01; A vs C, p < 1E (−9); B vs C, p < 0.005.