
Figures & data
Table 1 Baseline Characteristics
Table 2 Predictors for Mortality and/or Major CV Events (Univariate Analysis)
Figure 1 Kaplan–Meier survival curve showing cumulative survival free from mortality event (A) and from mortality and/or major CV event (B).
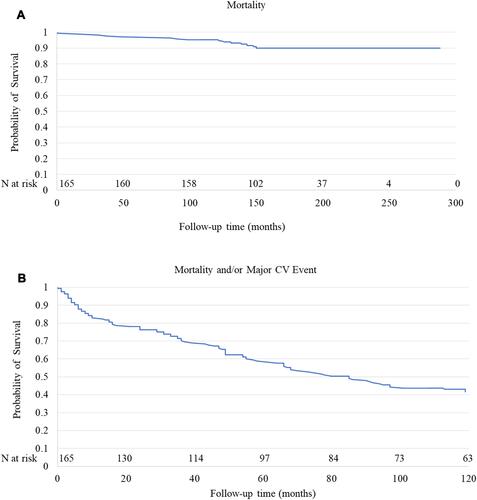
Figure 2 Kaplan–Meier survival curve showing cumulative survival free from mortality and major CV event in patient with and without hypertension.
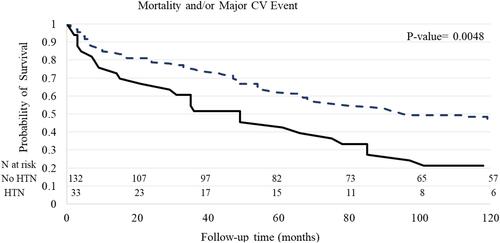
Table 3 Multivariable Cox Proportional Hazard Model for Major CV Event and/or Mortality
Table 4 Linear Model for Recurrent Annual Event (N=145)