Figures & data
Table 1 Physician demographics
Figure 1 Physicians’ use of guidelines for the management of cardiovascular risk factors.
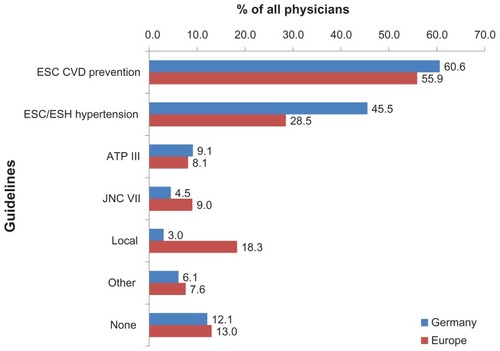
Table 2 Physicians’ reasons for not using clinical guidelines and global risk assessment tools, and beliefs about the limitations of risk assessment tools
Figure 2 Physicians’ use of global risk assessment tools (of those using these tools).
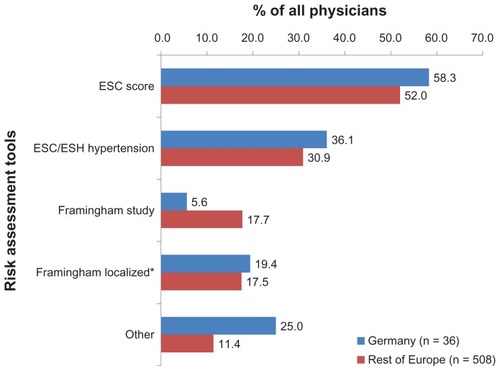
Table 3 Sociodemographic and clinical patient characteristics
Figure 3 Control of treated hypertension (<140/90 mm Hg), dyslipidemia (total cholesterol < 5 and LDL-c < 3 mmol/L),* type 2 diabetes (HbA1c < 6.5%), and obesity (BMI < 30 kg/m2) in special countries versus the average control rate in all countries.
Abbreviations: BEL, Belgium; FRA, France; GER, Germany; GRE, Greece; UK, United Kingdom; DL, dyslipidemia; DM, diabetes mellitus; HT, hypertension; OBES, obesity.
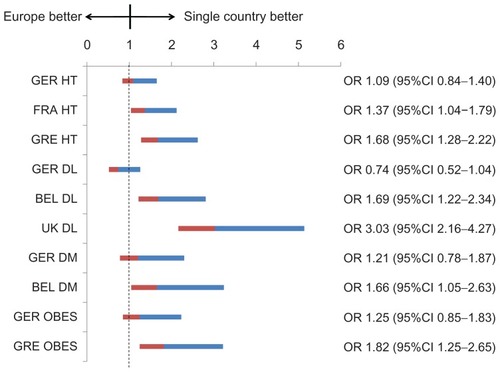
Table 4 Communication tips usually used for the management of behavioral risk factors (physicians)