Figures & data
Figure 1 Examination of the inferior vena cava (IVC) in the subcostal long-axis view 1 cm from the right atria-inferior vena cava junction.
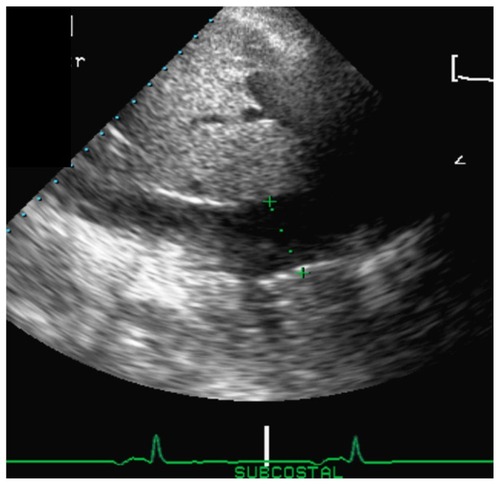
Table 1 Baseline characteristics of the study cohort (n = 77)
Table 2 Echocardiographic characteristics of study patients (n = 77)
Figure 2 Scatter plot of log-transformed brain natriuretic peptide (BNP) and inferior vena cava size (IVC).
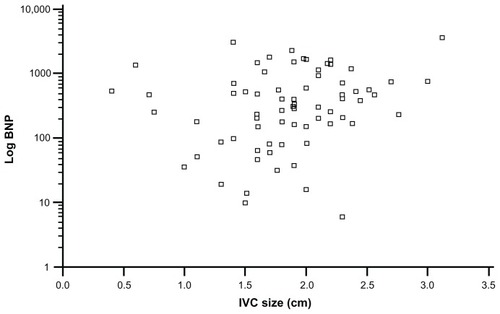
Figure 3 Scatter plot of log-transformed N-terminal pro-brain natriuretic peptide (NT-ProBNP) and inferior vena cava size (IVC).
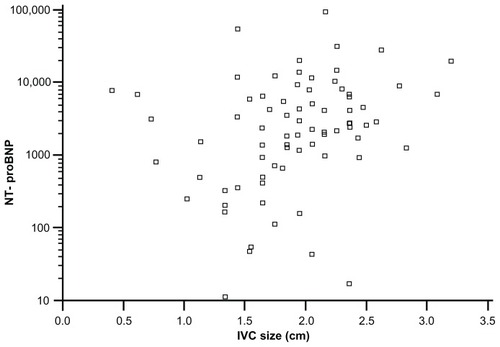
Figure 4 Scatter plot of log-transformed values of (A) N-terminal pro-brain natriuretic peptide (NT-ProBNP) and (B) brain natriuretic peptide (BNP) (Y axis) according to respirophasic changes in the inferior vena cava (IVC) size (X axis) (P = 0.46 and 0.36 for NT-ProBNP and BNP, respectively).
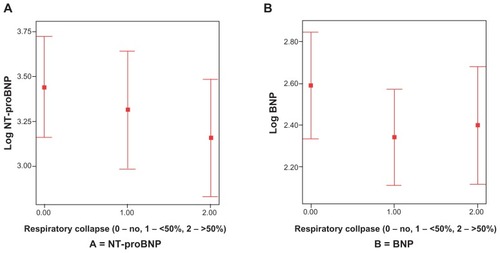
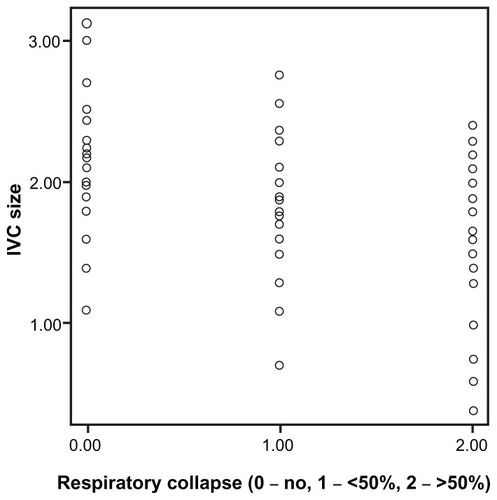
Figure 5 Scatter plot showing the relationship between inferior vena cava (IVC) size, cm, and the degree of IVC inspiratory collapse (analysis of variance P < 0.001).