Figures & data
Table 1 Demographic and clinical variables
Table 2 Indications for angiography and coronary artery distribution
Table 3 Angiographic and procedural variables
Figure 1 Kaplan-Meier curve showing target vessel failure survival for the Endeavor zotarolimus stent (solid line) versus the Everolimus stent (dashed line).
Abbreviation: TVF, target vessel failure.
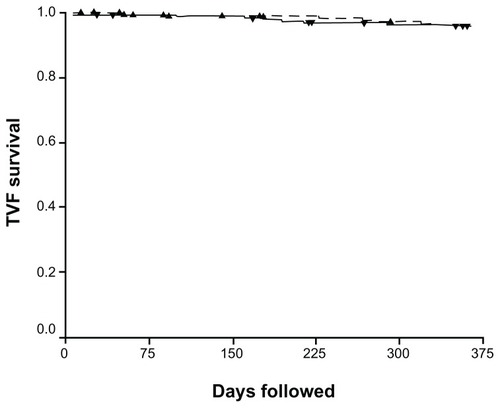
Table 4 Patient outcomes