Figures & data
Table 1 Vildagliptin monotherapy studies
Figure 1 Time course of mean HbA1c during one year of treatment with vildagliptin 50 mg once daily (closed triangles) or placebo (open circles).
Notes: Vildagliptin: n = 153 at baseline and 138 at week 52; placebo: n = 149 at baseline and 131 at week 52. Mean ± standard error. ***P < 0.0001 versus placebo. Adapted with permission from Scherbaum et al.Citation31
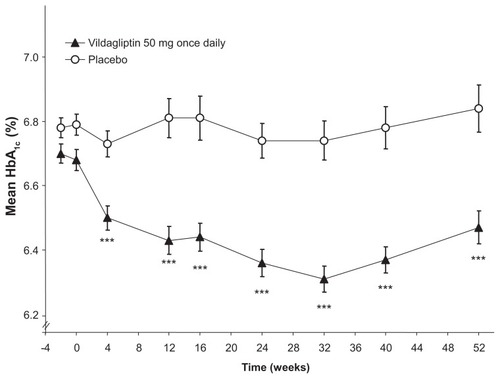
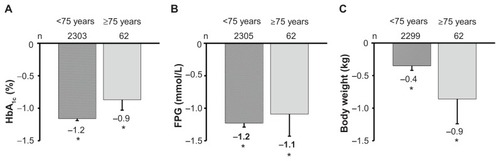
Figure 2 Change from baseline in HbA1c (A), fasting plasma glucose (B), and weight (C) with vildagliptin 50 mg twice daily in a pooled monotherapy population in patients stratified by age.Citation45 *P < 0.05 versus baseline; baseline values for patients <75 years and ≥75 years were 8.7% and 8.3%, respectively (A); 10.5 mmol/L and 9.7 mmol/L (B); and 86.1 kg and 74.9 kg (C).