
Figures & data
Figure 1 Study timeline.
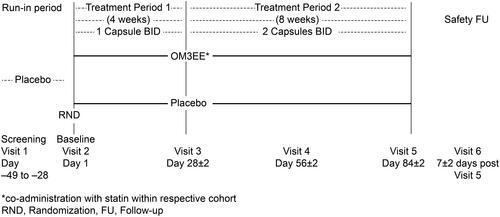
Figure 2 CONSORT diagram of the patient population of the study.
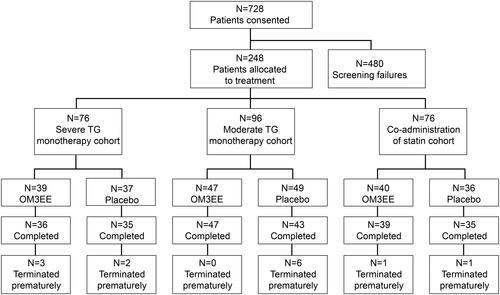
Table 1 Baseline Demographic, Lipid/Lipoprotein and Concomitant Medication Data for the sHTG Cohort
Table 2 TG Responses in the sHTG Cohort. All Data are Presented in the Form Mean (Standard Deviation)
Figure 3 Mean TG levels at baseline and end of treatment in the sHTG cohort. Notes: In the boxplot the black line within the box indicates the median and the box boundaries indicate the 25% and 75% percentiles. Whiskers below the box depict the 1% percentile, whiskers above the box depict the 95% percentile. Points above the whiskers indicate outliers above the 95% percentile.
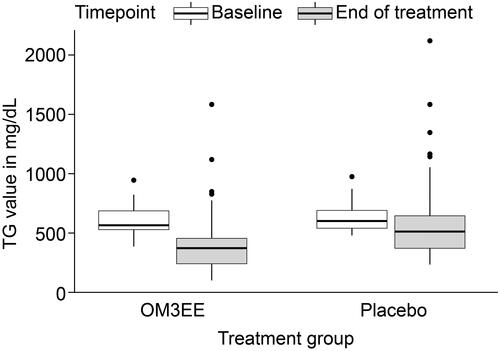
Table 3 Non-TG Lipid and Lipoprotein Responses in the sHTG Contingent. All Data are Presented in the Form Mean (Standard Deviation)
Table 4 Adverse Events Affecting ≥2% of Patients in Each Treatment Assignment of the Overall Safety Population (n=248). Findings are Categorized by System Organ Classification (Grey Rows) and Preferred Term and Presented in the Form n (%)