Figures & data
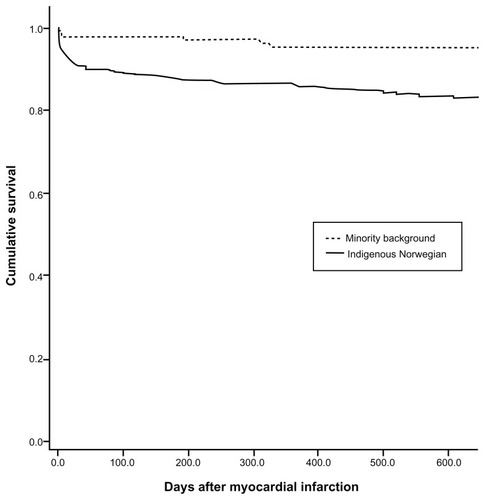
Figure 1 Flow chart of the dual-design study, incorporating comparative cross-sectional study and cohort study.
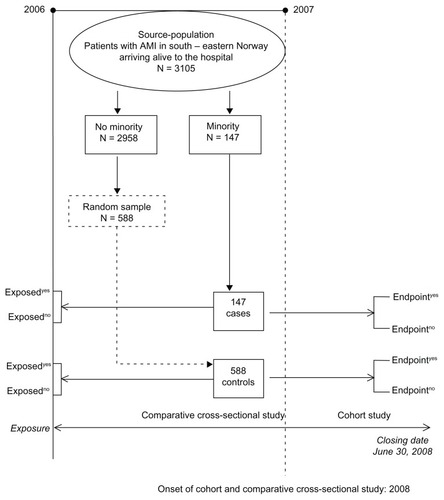
Figure 2 Regression line showing the association between concentration of serum high-density lipoprotein (HDL) and age.
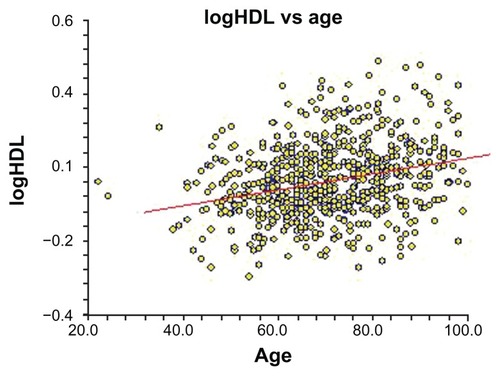
Table 1 Clinical profile of patients with acute myocardial infarction (MI) of minority versus nonminority background
Table 2 Gradient effect of age interval by quartiles and frequency of risk factors using the Mantel–Haenszel test of linear trend
Table 3 Risk factors differentiating patients with acute myocardial infarction of minority background versus those from nonminority background using the multivariate logistic model with a prognostic strategy
Table 4 Hospital outcomes and mortality stratified on the nature of acute myocardial infarction ST-segment elevation myocardial infarction (STEMI) versus non-STEMI
Table 5 Adjusted odds ratio (OR) for patients with acute myocardial infarction (AMI) with minority background versus those from nonminority background using a logistic regression model and Cox’s regression model, controlling for multi-confounders
Figure 3 Kaplan–Meier survival plot for patients with minority background versus indigenous Norwegian patients.