Figures & data
Table 1 Comparison of Demographic and Clinical Characteristics in Subjects with or without Atrial Fibrillation (Cross-Sectional Study)
Table 2 Logistic Regression Model for the Presence of Atrial Fibrillation After Propensity Score Matching (Cross-Sectional Study)
Table 3 Comparison of Demographic and Clinical Characteristics in Subjects with or without the New-Appearance of Atrial Fibrillation During the 4-Year Period (Cohort Study)
Table 4 Cox-Proportional Hazard Model for the Association of the New-Appearance of Atrial Fibrillation with Clinical Variables (Cohort Study)
Figure 1 Discriminatory power of CAVI for the prediction of the new-appearance of atrial fibrillation (cohort study). The receiver-operating-characteristic curve shows the performance of CAVI to discriminate new-appearance of AF. The Youden Index was used in to select the optimal cut-off point of CAVI.
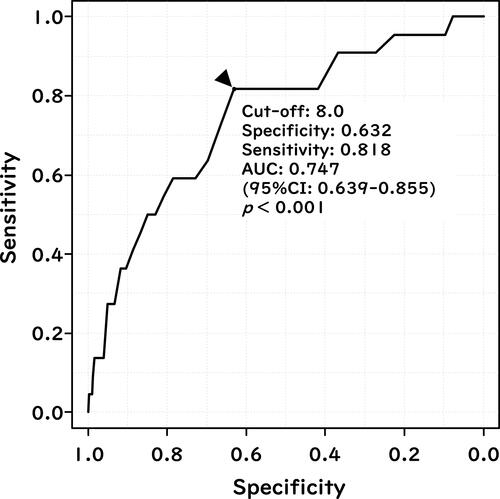
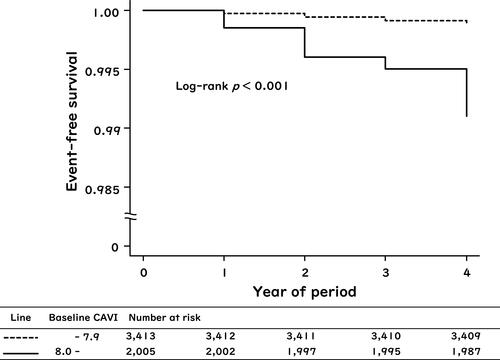
Figure 2 Kaplan–Meier curves for the rates of the new-appearance of atrial fibrillation when subjects were stratified by baseline CAVI (cohort study). Participants were divided into two groups: those with baseline CAVI ≥ 8.0 and those with baseline CAVI < 8.0.