Figures & data
Figure 1 Pathways of platelet protease-activated receptor (PAR)-1 activation.
Notes: Activated PAR-1 can signal through the Gα12/13, Gαq, and Gαi/z families. The α-subunits of G12 and G13 bind Rho GEFs and induce Rho-mediated cytoskeletal responses, leading to changes in platelet shape. The Gαq binds phospholipase Cβ to generate IP3, which promotes calcium mobilization and protein kinase C activation. This then activates pathways leading to granule secretion, as PAR-1-stimulated Gαq-coupled adenosine diphosphate release is especially important for thrombin-mediated platelet activation. The Gβγ subunits can activate PI3-kinase and other lipid-modifying enzymes, protein kinases, and channels. The PI3-kinase modifies the inner leaflet of the plasma membrane to provide molecular docking sites. Activation of PAR-1 can also activate growth-factor shedding and activation of receptor tyrosine kinases involved in cell growth and differentiation. Reproduced with permission from John Wiley and Sons. Coughlin SR. Protease-activated receptors in hemostasis, thrombosis and vascular biology. J Thromb Haemost. 2005;3(8):1800–1814.Citation18 Copyright © 2005, John Wiley and Sons.
Abbreviations: GEFs, guanine nucleotide exchange factors; IP3, inositol trisphosphate 3; PI3-kinase, phosphoinositide-3 kinase; MAP, mitogen activated kinase; DAG, diacylglycerol; WASP, Wiskott–Aldrich syndrome protein; SRE, serum response element; MLC, myosin light chain; PHD, prolyl hydroxylase domain.
Abbreviations: GEFs, guanine nucleotide exchange factors; IP3, inositol trisphosphate 3; PI3-kinase, phosphoinositide-3 kinase; MAP, mitogen activated kinase; DAG, diacylglycerol; WASP, Wiskott–Aldrich syndrome protein; SRE, serum response element; MLC, myosin light chain; PHD, prolyl hydroxylase domain.
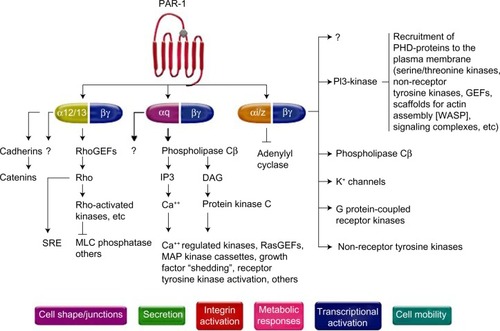
Figure 2 Chemical structure of vorapaxar.
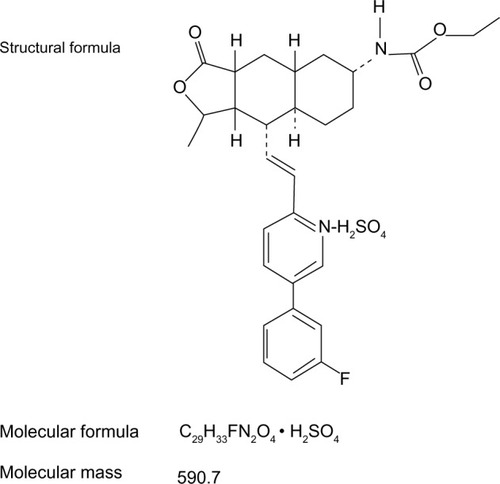
Table 1 Efficacy and safety end points in the TRACER (at 2 years) trial
Table 2 Efficacy and safety end points in the TRA 2°P – TIMI 50 (at 3 years) trial
Figure 3 Kaplan–Meier curve of estimated occurrence of cardiovascular death, myocardial infarction, or stroke in TRA 2°P – TIMI 50 prior myocardial infarction cohort.
Note: Reprinted from The Lancet, Vol 380, Scirica BM, Bonaca MP, Braunwald E, et al, Vorapaxar for secondary prevention of thrombotic events for patients with previous myocardial infarction: a prespecified subgroup analysis of the TRA 2°P-TIMI 50 trial, 1317–1324.Citation57 Copyright © 2012, with permission from Elsevier.
Abbreviations: HR, hazard ratio; CI, confidence interval; TIMI, Thrombolysis in Myocardial Infarction.
Abbreviations: HR, hazard ratio; CI, confidence interval; TIMI, Thrombolysis in Myocardial Infarction.
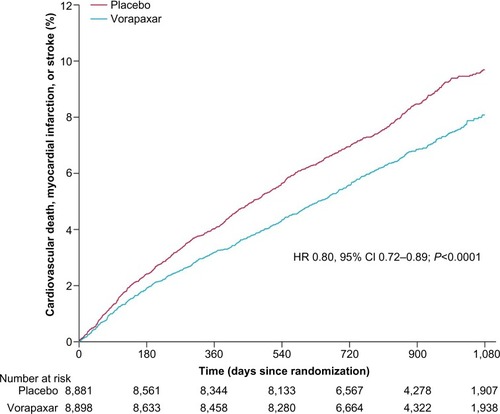
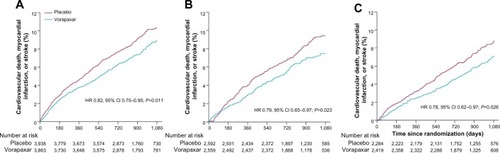
Figure 4 Kaplan–Meier estimates of cardiovascular death, myocardial infarction, or stroke according to time from qualifying myocardial infarction to randomization: <3 months (A), 3–6 months (B), and >6 months (C) in the TRA 2°P–TIMI 50 prior myocardial infarction cohort.
Note: Reprinted from The Lancet, Vol 380, Scirica BM, Bonaca MP, Braunwald E, et al, Vorapaxar for secondary prevention of thrombotic events for patients with previous myocardial infarction: a prespecified subgroup analysis of the TRA 2°P-TIMI 50 trial, 1317–1324.Citation57 Copyright © 2012, with permission from Elsevier.
Abbreviations: HR, hazard ratio; CI, confidence interval; TIMI, Thrombolysis in Myocardial Infarction.
Abbreviations: HR, hazard ratio; CI, confidence interval; TIMI, Thrombolysis in Myocardial Infarction.