Figures & data
Figure 1 Phenotypic subtypes of hypertrophic cardiomyopathy, differentiated by region of hypertrophy. (A) Representation of a normal human heart. (B) Type A/type I hypertrophy results in a sigmoid septum with discrete hypertrophy of the basilar septum with less severe hypertrophy of the basolateral wall. (C) Type B/Type II hypertrophy involves the majority of the basilar septum and in three dimensions spirals anteriorly as it tracts down to the apex. (D) Type C hypertrophy (a subclass of Type III hypertrophy) denotes primarily uniform hypertrophy of both the septum and the posterior wall. (E) Type D (a subclass of Type IV hypertrophy) primarily involves the apex with minimal hypertrophy in the septum or posterior wall. (F) Type E (a subclass of Type III hypertrophy) involves both the septum and the posterior wall with minimal apical involvement and can lead to mid-cavitary gradients.
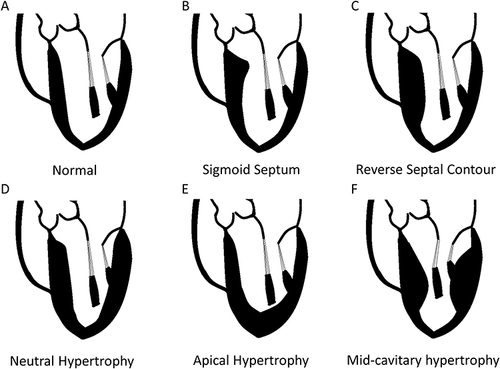
Table 1 Genes Responsible for the Development of Hypertrophic Cardiomyopathy
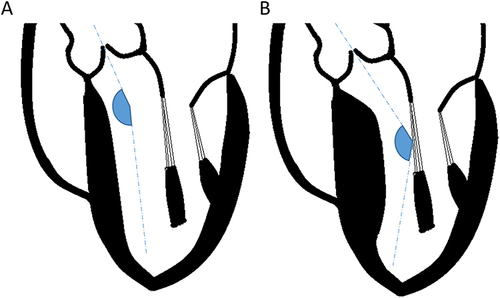
Figure 2 Left ventricle to aortic root angulation and its impact on left ventricular outflow tract gradient. (A) In structurally normal hearts, the left ventricular to aortic root angle (LVARA) is greater than 140°. (B) With septal hypertrophy, the LVARA decreases, and more blood is directed toward the anterior leaflet of the mitral valve. This is thought to promote a Venturi effect and drag forces that increase the left ventricular outflow tract gradient and promote systolic anterior motion of the mitral valve.