
Figures & data
Figure 1 Flow chart of study individuals.
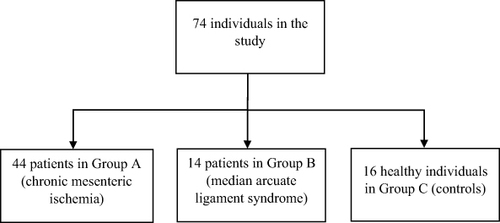
Table 1 Patient Demographics
Figure 2 (A) Median plasma α-glutathione S transferase (α-GST) levels in the patients with chronic mesenteric ischemia due to atherosclerosis (Group A, n=30), and (B) median arcuate ligament syndrome (Group B, n=14), before and after the surgical or endovascular intervention, compared with healthy individuals (Group C, n=16). Boxplot represents the 10th, 25th, 50th, 75th, and 90th percentile, with the black horizontal line representing the median. Filled black dots represent outliers. The dotted horizontal line in red represents the upper limits of normal α-GST plasma level. Mann–Whitney U-test is used to test differences between the groups.
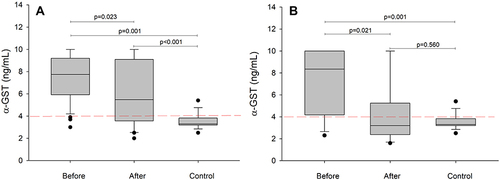
Table 2 Analysis of Plasma α-GST >4 ng/mL as the Cut-off for the Diagnosis of Patients with CMI of Atherosclerotic Origin and MALS
Figure 3 Receiver operating characteristic (ROC) curve and area under the curve (AUC) of median plasma α-GST levels in the patients with chronic mesenteric ischemia (CMI, n=44) due to atherosclerosis and median arcuate ligament syndrome (MALS, n=14). Black (O) and red (O) represent the threshold values for the corresponding sensitivity and specificity. The upper limit of 4 ng/mL was used as a cut-off for α-GST levels. The Grey 45° diagonal line represents random chance (AUC=0.5).
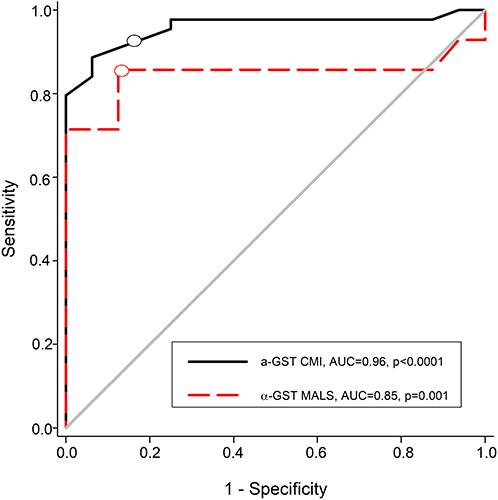
Table 3 Median Plasma Levels of Candidate Mesenteric Ischemia Biomarkers in Patients with CMI Due to Atherosclerosis (Group A), and MALS(Group B), Compared with Healthy Individuals in Group C
Table 4 Baseline Plasma Levels of Pancreas Amylase, AST, ALT, CRP and Creatinine in Patients with CMI (Group a, n=44), MALS (Group B, n=14), and Healthy Individuals (Group C, n=16)