Figures & data
Table 1 Bivariate Correlations Between the Explanatory Variables and the Variations of the CIMT in the Study Population
Figure 1 Draws the histogram of the distribution of the CIMT according to the standardized (A) and reproducible regression (B) corresponds to the expected cumulative probability of variations in the CIMT (C).
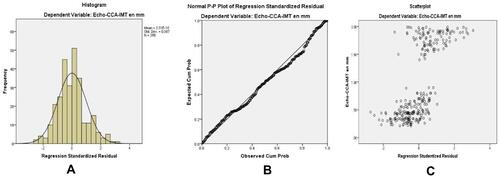
Table 2 Multiple Linear Regression of Variables Predicting Variations in the CIMT
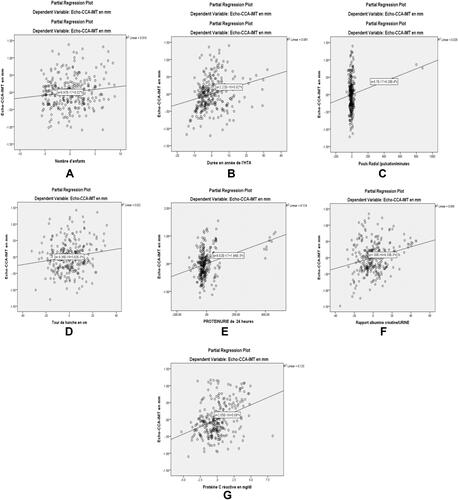
Figure 2 Corresponds to the expected cumulative probability of variations in the CIMT. Figures draw the different regression lines showing the number of children (A), the duration in years of hypertension (B), the radial pulse (C), the Hip circumference (D), the 24-hour proteinuria (E), the urinary albumin/creatinine ratio (F), and the significant multivariate correlations between the CIMT and the CRP (G).