Figures & data
Figure 1 Radial pulse wave recording in a healthy adult. It was normalized in amplitude (0% −100%). The oscillation observed at the beginning of diastole depends on the distal arteries compliance.
Abbreviations: DA, diastolic amplitude; RAIx, radial augmentation index.
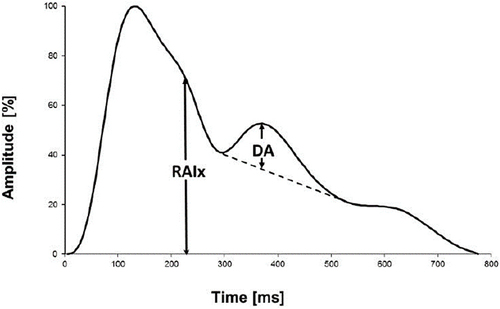
Figure 2 Effects of aging in healthy individuals. With increasing age, the systolic wave widens, and the oscillation amplitude flattens.
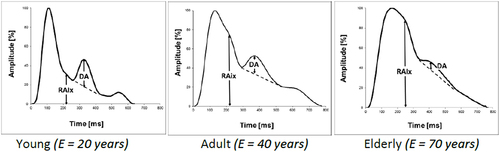
Table 1 General Characteristics of All Cases
Figure 3 Variation of DA with age in healthy individuals of both sexes. Males: Gray diamonds, Females: Black squares. The approximation curves are 2nd order polynomials. The determinant coefficient values are R2= 0.35 for females and R2= 0.49 for males.
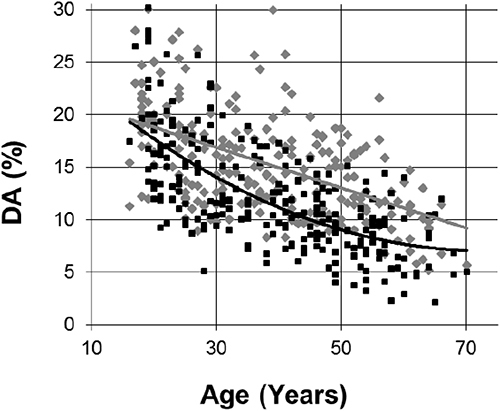
Table 2 Linear Regression Coefficients of the Variable DA, for Both Sexes