Figures & data
Table 1 Demographic Characteristics and Clinical Data of Subjects
Table 2 Examination of Gene P2Y12
Table 3 Characteristics of Adjunctive Examination Results
Table 4 Correlation Between Adjunctive Examination and P2Y12
Table 5 Correlation Between P2Y12 and Clopidogrel Resistance
Table 6 Comparison of the Mean BMI in the Response and Non-Response Groups
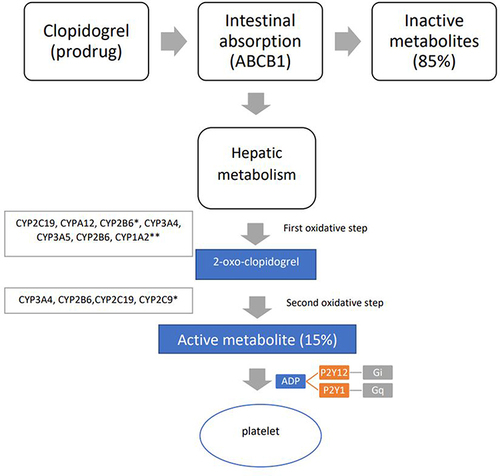
Figure 1 Clopidogrel Metabolism.
Notes: Clopidogrel is a prodrug, 85% of clopidogrel is hydrolyzed by esterases and converted to inactive derivatives, another 15% is metabolized by hepatic cytochrome P450 (CYP450) and converted to intermediate metabolites. Adapted from Zhang Y, Li M, Tang J and Chen X. Pharmacokinetic and Pharmacodynamic Responses to Clopidogrel: Evidences and Perspectives. Int. J. Environ. Res. Public HealthCitation33 307–316, Copyright 2011, with permission from Elsevier.Citation34