
Figures & data
Table 1 Regression Between Lp(a) and CAD Risk Factor
Table 2 Clinical and Biochemical Features of the Study Population by Lp(a) Categories
Figure 1 Binomial logistic regression analysis between the different categories of Lp(a) and CVD risk factors. The squares indicate odds ratios for high Lp(a), and the horizontal lines indicate 95% confidence intervals (CI). Obesity: BMI ≥30 Kg/m2. Older age: patients aged ≥65. High HDL: HDL ≥ 35 mg/dL. High LDL: LDL ≥ 100 mg/dL.
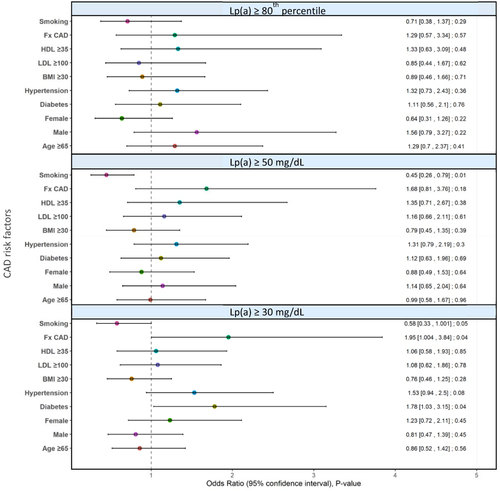
Figure 2 Multinomial logistic regression analysis between CAD category (number of vessels with >50% stenosis) and Lp(a) ≥30 mg/dL, Lp(a) ≥50 mg/dL and Lp(a) ≥80th percentile. CAD category 1: patients with >50% stenosis in one vessel; CAD category 2: patients with >50% stenosis in 2 vessels; and CAD category 3: patients with >50% stenosis in 3 or 4 vessels. Values are odds ratio (95% Confidence Interval).
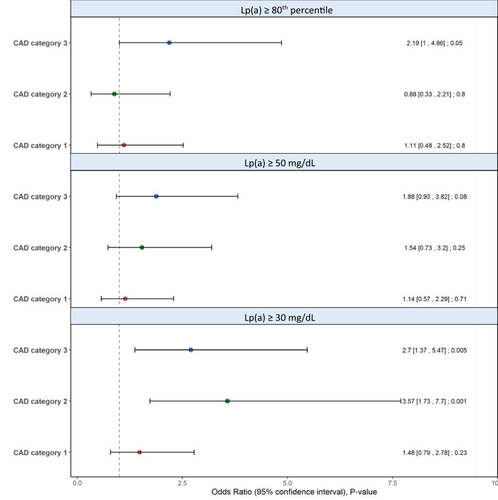
Table 3 Association of SNPs in LPA with Risk of Coronary Artery Disease